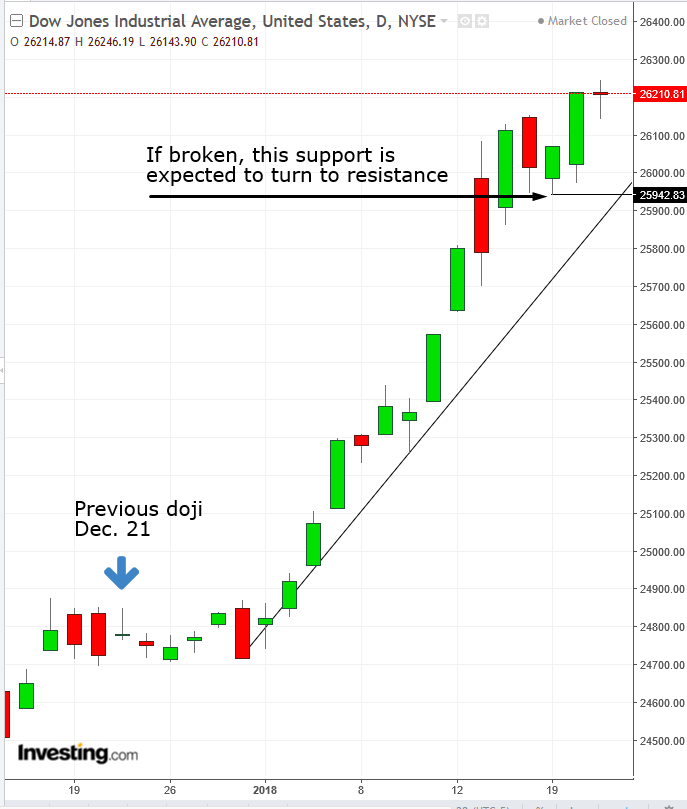
The Dow Jones Industrial Average was the only major index to decline yesterday. Although it declined by less than six points, it formed a doji after traders tried to push both up and down, resulting in little change.
A doji is a distinct trend change signal, especially during rallies.
There are three criteria for a more reliable doji:
- Confirmation (i.e. further weakness).
- An overbought market.
- That the doji is singular. If it follows previous multiple doji it is rendered ineffectual in the current market dynamic, as already proven by the preceding ones.
Is This Dow Doji Reliable?
Let’s examine the current doji according to these criteria.
The first criterion (further weakness) obviously requires waiting. A long red candle which would close below the 26,000 would signify such weakness, forcing the bulls who rode the price up 0.75 percent from Monday’s 26,025 opening price to its 26,214 closing price, to liquidate positions. A close beneath the 25,942 would clear the January 17-19 congestion, signaling the demand of that price level is gone, in which case a supply glut would force the price further down. As well, the decline to that price should cross below the uptrend line, per its current angle since December 29, increasing the likelihood that this year’s rally is over, at least at its current pace.

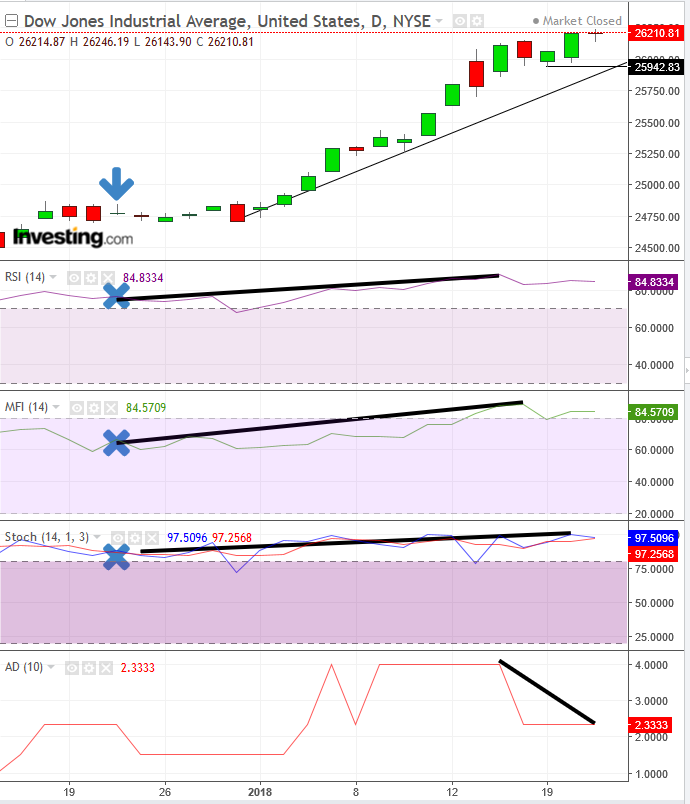
As for the second criterion (namely that the market is overbought), the RSI, Money Flow Index and Stochastic are all overbought. However, there is an argument to be made that a severely overbought RSI is actually bullish, something my mentor Ralph Acampora, the Godfather of technical analysis, recently told me, about this very RSI. That’s why a confirmation of the doji is necessary.
As for the question of repeat dojis, the last doji appeared on December 21. This makes yesterday’s doji the first of this year’s rally. While that doji didn’t lead to a decline, its effectiveness may have been in that it took six trading days for stocks to resume rising. Second, the lack of an actual decline may be attributed to several factors: (1) The market was not nearly as overbought (marked by the X; the line demonstrates the rise since. (2) It followed a two-day sideways move, leaving it no momentum to deflate, while yesterday’s doji follows the 8th record out of the 15 trading days this year (which is the best start of a year for the market’s original index since 2003), leaving it plenty of momentum to deflate.
Confirmation for yesterday’s doji on the Dow can be found with the leading gauge, the S&P 500 Index. Although it gained 0.22 percent, the internals paint a mixed picture, based on sector analysis. As opposed to the current rally in which most sectors were in the green, yesterday 4 were in the red, of which 2 were growth stocks.
Additionally, market breadth has fallen in the last week per the Advance Decline Line, signaling that the headline rallies are carried mostly by mega caps, which is unsustainable.

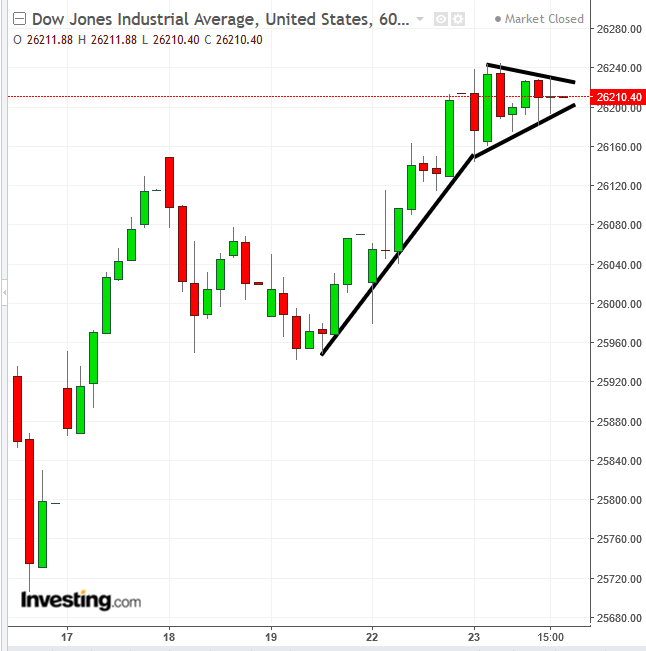
It is important to warn that in addition to the bullish argument on a severely overbought RSI, a bullish pennant is potentially forming on the hourly chart. An upside breakout would overcome any bearishness there may have been in the market. On the other hand, a downside breakout may confirm and support negative sentiment.
Trading Strategies – Short Position
Conservative traders trade only with the trend, and this one is most definitely still up.
Moderate traders might risk trading against the long-term uptrend, after the price crosses below the uptrend line of the year and produces two falling peaks and troughs.
Aggressive traders may chance a short upon a cross below the 25,900-psychological round number, clearing the January 17-19 congestion and crossing below the uptrend line since the start of the year.
Traders may place a stop-loss above the 25,900 level, whose broken support is expected to turn to resistance, as bears are encouraged and bulls are discouraged.
