The financial market has become increasingly complex. See our Opening Bell for more on that. In this post we will discuss the conflicting signals coming from Europe's leading stock average, the STOXX 600.
Fundamentally, the market narrative is that European stocks declined yesterday on a rising euro – expected to hurt European exports – and advanced today on a weakening euro – expected to boost exports.
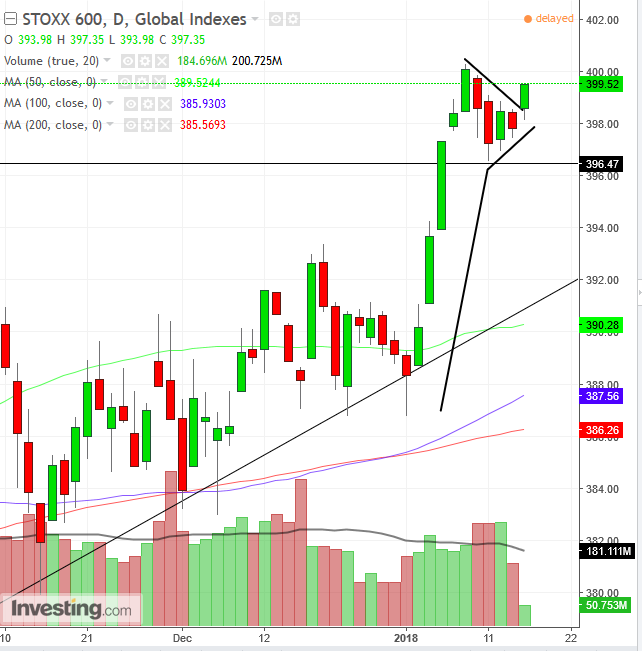
Technically, yesterday was part of profit-taking on a 3.5 percent move in 6 days. The sharp, rapid move is called a flag-pole, and the price halt occurs when un-participating traders notice the sudden momentum and want a piece of the action in stocks, which they buy from early-bird traders who already held the stocks before the move, and now want to cash out.
This dynamic is indicated by the volume. Notice, that when the dynamic changed from ranging to trending the volume began rising but that the highest volume was actually during the formation of the pennant. If the pennant’s range was because of a lack of interest, volume would subside, as there would be less activity. However, the volume only increased, which shows that activity increased. That supports the bullish outlook – that there are more buyers into the new move than sellers out of the prior move – for a pennant (same as flag) within a rising trend.

Today, the rally performed an upside breakout to the pennant, signaling that the trend, prior to the interruption, would resume.
However, there is a caveat. The volume.
According to our volume analysis, the volume should spike higher, to demonstrate that this move is recognized by the majority, not simply because few participants were allowed an opposition-less move.
The overall picture is promising, the 100 dma (blue) rose above he 200 dma (red), along with the recent rally, providing a golden cross. The 50 dma (green) aligned itself with the uptrend line since August 29, revealing where the supply-demand pressure point is, and the significance of this uptrend line.
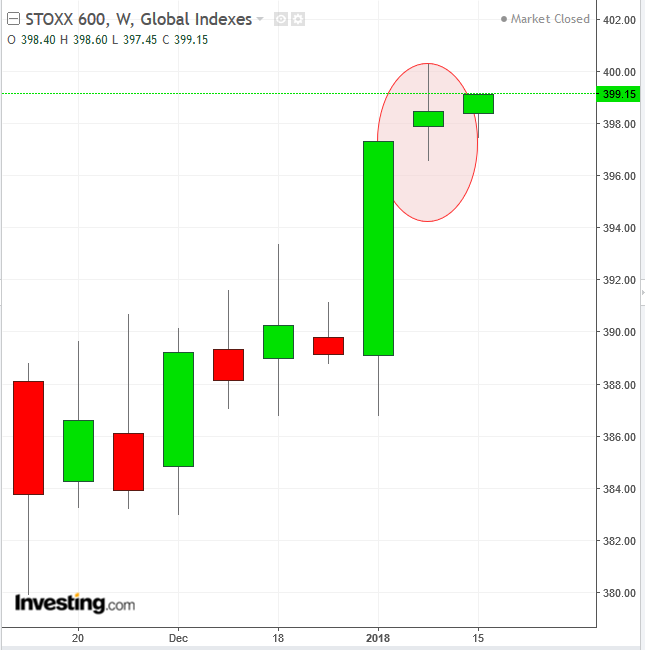
Still, an omen might be found on the weekly chart.
Last week’s price action formed a high wave candle. The fact that investors tried going up but failed, then tried going down but failed, to finally do nothing, allowing the price to close near its open, suggests they lack direction. They have no clue. This candle potentially warns of a reversal. The fact that this candle formed right on the small breakout makes its potential message all the louder.

Bottom Line
With these contradictory signals, how can a trader make his way in the market?
My mentor is Ralph Acampora who has been called 'The Godfather of Technical Analysis,' having been in the market for 50 years, forecasting – against everyone else – the biggest bull market in US history in the 90s. He told me that the older and more experienced he gets, the more he realizes to focus on price.
Following Godfather’s advice, we adopt a bullish stance, despite the low volume on the pennant breakout.
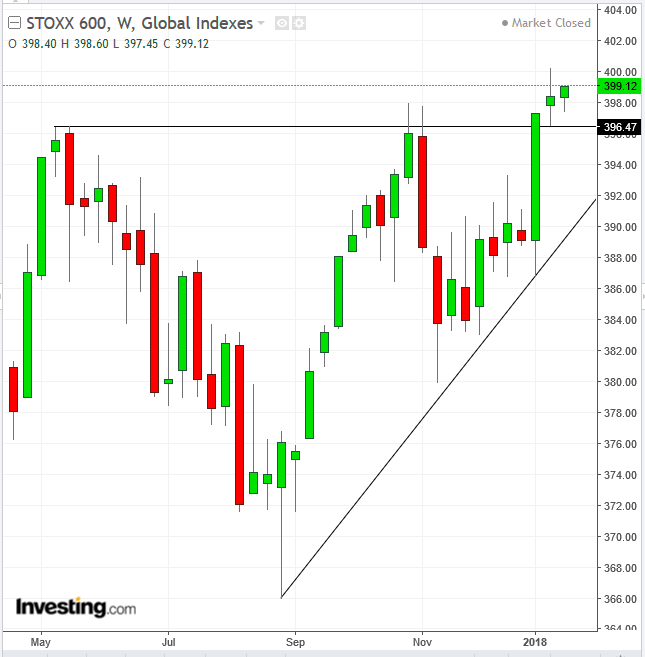
In the same time, the index has completed an ascending triangle since May.
This pattern clearly demonstrates the over-eagerness of buyers compared to sellers, who ultimately crossed the sellers’ line (triangle top).
However, traders should beware of a bull-trap, as the breakout is only 0.93 percent deep, not even fulfilling the minimum 1.00 percent aggressive filter. Also, here, the volume does not cooperate, as it declined on the breakout.

Still, the higher peak registered in January above 400 resumes the uptrend.
Trading Strategies: Long Position
- Conservative traders might want to see higher volume, as well as an advance past the January 9, 400.11 peak to join the rally, followed by a return move to test the integrity of the pennant.
- Moderate traders may wait for either higher volume or for a higher peak before entering a long position.
- Aggressive traders can now enter a long, with a stop beneath 396.
Targets
- Pennant: height of flag-pole: 13.50 euro from point of breakout.
- Ascending Triangle: height of triangle: 30.50 euro from point of breakout.
