
Castlight Health Inc. (NYSE:CSLT) reported first-quarter 2018 non-GAAP net loss of 6 cents per share, narrower than the Zacks Consensus Estimate of 8 cents per share. However, the figure was wider than year-ago quarter’s loss of 5 cents per share.
Notably, the company has adopted the new revenue rules of ASC 606 and incorporated the same while reporting the first-quarter results.
Revenues surged 31.7% year over year to $36.5 million and matched the Zacks Consensus Estimate.
Subscription revenues (90.4% of total revenues) increased 27.4% to $33 million. Castlight’s first-quarter marked a record of 29 new customers and 26 cross-sell products in the quarter. Professional services & other (9.6% of total revenues) soared 93.2%year over year to almost $3.5 million.
Castlight Health, inc. Revenue (TTM)
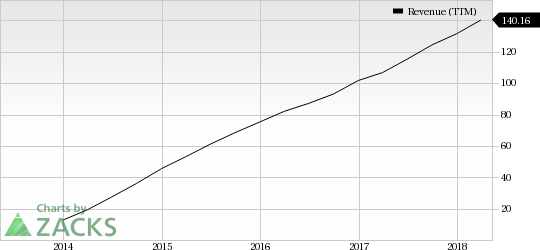
Castlight Health, inc. Revenue (TTM) | Castlight Health, inc. Quote
Quarter Highlights
Management remains elated on delivering Anthem Engage on Jan 1, “on time and at scale”. Approximately more than 800,000 lives were launched across 20 individual employers. Lighter version of Engage app was launched across Colorado and California.
On a pro forma basis, annualized recurring revenue (“ARR”) came in at $163.9 million which grew 17% year over year, primarily driven by cross selling of wellbeing clients into legacy care guidance and adoption of the company’s new platforms.
Transparency-only ARR accounted for 19% of total ARR. Four transparency customers migrated to the Castlight platform in the quarter.
The company had approximately 250 signed customers at the end of the quarter, out of which roughly 30% were Fortune 500 companies.
Operating Details
Non-GAAP gross margin came in at 63% down from the year-ago quarter figure of 73.7%. Subscription gross margin contracted 940 basis points (bps) to reach 75.6%.
Non-GAAP sales & marketing expenses as percentage of revenues declined 800 bps to 33.8% in the quarter. General & administrative expenses contracted 320 bps to 15.2%.
However, non-GAAP research & development expenses expanded 260 bps to 35.1%, considering the investment pertaining to the launch of Anthem Engage and the upcoming Castlight Complete.
The company continues to invest heavily on research & development, particularly on the upcoming consolidated platform that will include Castlight and legacy Jiff products, as well as the newly launched Anthem Engage.
Castlight reported non-GAAP operating loss of $7.7 million wider than $5.3 million in the year-ago quarter.
Cash Position
As on Mar 31, 2018, total cash, cash equivalents & marketable securities was $74.6 million, down from $93.3 million in the previous quarter.
Castlight Health, inc. Price, Consensus and EPS Surprise
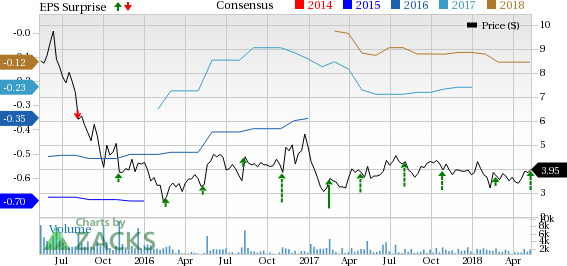
Castlight Health, inc. Price, Consensus and EPS Surprise | Castlight Health, inc. Quote
Guidance
For 2018, Castlight reiterated the outlook. The company continues to forecast revenues between $150 million and $155 million.
On the back of company’s persistent focus on converting the transparency customers to the Castlight platform, the figure is anticipated to reach 15% on by end of fiscal 2018.
Non-GAAP operating loss is expected in the range of $15-$20 million. Non-GAAP loss is anticipated between 11 cents and 15 cents per share.
For the second quarter, Services revenues are expected to decline sequentially as first-quarter revenues marked an increase of $0.5 million as one-time revenue increase pertaining to the development of the Anthem. Gross margin is expected to improve sequentially.
Management anticipates reporting breakeven in fourth-quarter of 2018. The company’s higher level of investments on research & development is expected to continue, as it focuses on expanding offerings globally.
Additionally, Castlight stated that it remains on track to be breakeven on the cash flow basis from operations in the fourth quarter.
Zacks Rank and Key Picks
Castlight carries a Zacks Rank #3 (Hold).
Some better-ranked stocks in the broader technology sector are Western Digital (NASDAQ:WDC) , Mellanox (NASDAQ:MLNX) and Micron (NASDAQ:MU) , each sporting a Zacks Rank #1 (Strong Buy). You can see the complete list of today’s Zacks #1 Rank stocks here.
The projected earnings growth rate (3-5 years) for Western Digital, Mellanox and Micron are 19%, 15% and 10%, respectively.
Looking for Stocks with Skyrocketing Upside?
Zacks has just released a Special Report on the booming investment opportunities of legal marijuana.
Ignited by new referendums and legislation, this industry is expected to blast from an already robust $6.7 billion to $20.2 billion in 2021. Early investors stand to make a killing, but you have to be ready to act and know just where to look.
See the pot trades we're targeting>>
Western Digital Corporation (WDC): Free Stock Analysis Report
Castlight Health, inc. (CSLT): Free Stock Analysis Report
Mellanox Technologies, Ltd. (MLNX): Free Stock Analysis Report
Micron Technology, Inc. (MU): Free Stock Analysis Report
Original post
Zacks Investment Research