Get 40% Off
👀 👁 🧿 All eyes on Biogen, up +4,56% after posting earnings. Our AI picked it in March 2024.
Which stocks will surge next?
Unlock AI-picked Stocks

Cash Balances Could Push Stock Market Much Higher

Published 11/20/2019, 12:21 PM
Updated 07/09/2023, 06:31 AM

Highest In A Decade

According to Lipper and The Wall Street Journal, money market balances were basically identical on October 30, 2019 and March 25, 2009.
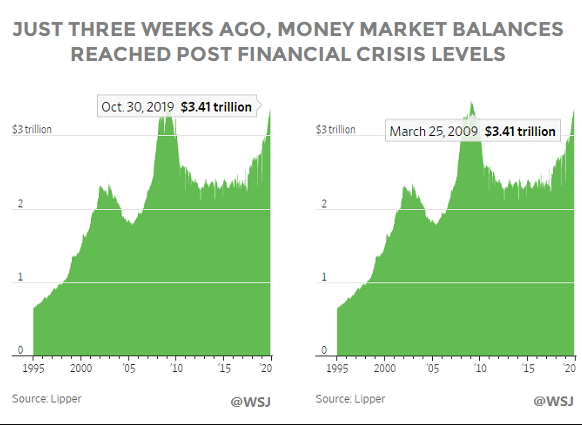
Money Market Balances

It is easy to understand how money market balances reached extremely high levels in March 2009, given investors had just lived through a painful 56% drop in the S&P 500.
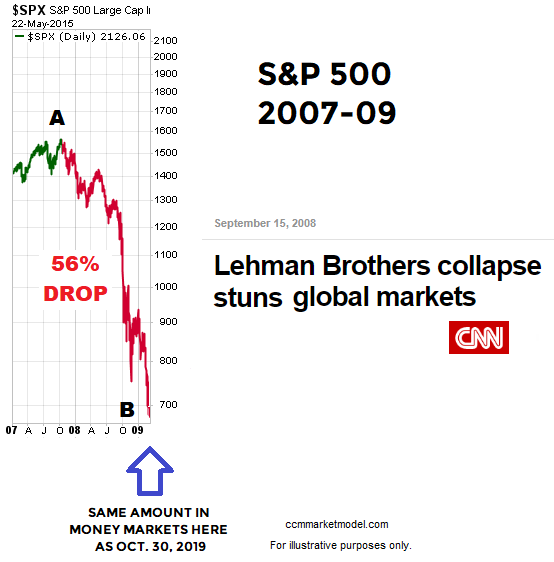
Daily S&P 500: 2007-2009

It is also easy to understand how the $3.41 trillion in money market funds on March 25, 2009 helped push the S&P 500 much higher over the next six years.
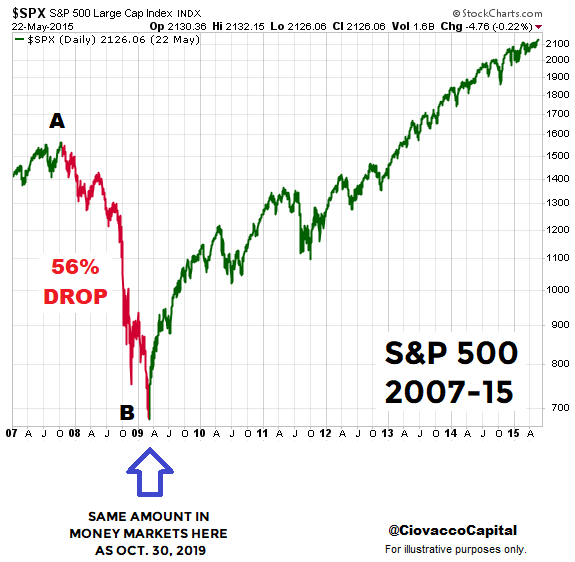
Daily S&P 500: 2007-2015

Given the technical and fundamental facts we have in hand today, it is a bit more difficult to understand how money market balances, just three short weeks ago, were sitting at basically the same level seen in the wake of the 2007-09 crisis that featured the collapse of several key components of the global financial system.
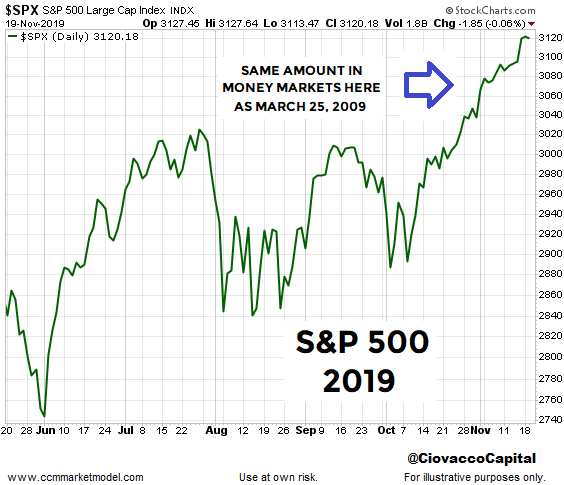
S&P 500: 2019

A Small Part Of The Weight Of The Evidence

From The Wall Street Journal:

Assets in money-market funds have grown by $1 trillion over the last three years to their highest level in around a decade, according to Lipper data. A variety of factors are fueling the flows, from higher money-market rates to concerns over the health of the 10-year economic expansion and an aging bull market. Some analysts say the heap of cash shows that investors haven’t grown excessively exuberant .

This post covers a set of facts; nothing more and nothing less. Even if the data above can be explained away, it would have little impact on the weight of the evidence covered in last week’s video. As always, we will continue to take it day by day and see how the facts unfold. We will most likely be covering several new studies in the next CCM weekly stock market video.

3rd party Ad. Not an offer or recommendation by Investing.com. See disclosure here or remove ads .

Latest comments

trade with Chris, many profits I count!
And im a bull. But its soooooo obvious. And i mean any second. Not days away.
Wrong. First you need a 20% correction. It’s so easy to see it’s not even funny. Seen this so many times over the last 30 years but this is the worst FOMO and overvalued market I’ve ever seen with 1 to 2% earnings growth LOL LOL
Not to mention how much more money was printed during the past 10 years. Equal amount means a much decreased percentage.
writers like this have no idea what is going on. They have no clue about basic economic terms. Every single dollar of cash in the world has to be held by someone at the close of business. There are never a situation where there is Cash on the sidelines. That is just people who are Spin Doctors spinning the false prosperity cycle that are fed has created.
same amount... 10 years layer means inflation makes it worth a lot less in value. dont forget that
Apparently, mutual fund cash levels are at the lowest levels ever...isn't that bearish?
Because the money supply has greatly expanded since 2009 in percentage base this is less cash than in 2009.
Correlation != Causation
Risk Disclosure: Trading in financial instruments and/or cryptocurrencies involves high risks including the risk of losing some, or all, of your investment amount, and may not be suitable for all investors. Prices of cryptocurrencies are extremely volatile and may be affected by external factors such as financial, regulatory or political events. Trading on margin increases the financial risks.
Before deciding to trade in financial instrument or cryptocurrencies you should be fully informed of the risks and costs associated with trading the financial markets, carefully consider your investment objectives, level of experience, and risk appetite, and seek professional advice where needed.
Fusion Media would like to remind you that the data contained in this website is not necessarily real-time nor accurate. The data and prices on the website are not necessarily provided by any market or exchange, but may be provided by market makers, and so prices may not be accurate and may differ from the actual price at any given market, meaning prices are indicative and not appropriate for trading purposes. Fusion Media and any provider of the data contained in this website will not accept liability for any loss or damage as a result of your trading, or your reliance on the information contained within this website.
It is prohibited to use, store, reproduce, display, modify, transmit or distribute the data contained in this website without the explicit prior written permission of Fusion Media and/or the data provider. All intellectual property rights are reserved by the providers and/or the exchange providing the data contained in this website.
Fusion Media may be compensated by the advertisers that appear on the website, based on your interaction with the advertisements or advertisers.
© 2007-2024 - Fusion Media Limited. All Rights Reserved.