Monday, the Semiconductors ETF—VanEck Vectors Semiconductor ETF (NYSE:SMH)—cleared back over resistance from its 50-Day moving average at $242.07.

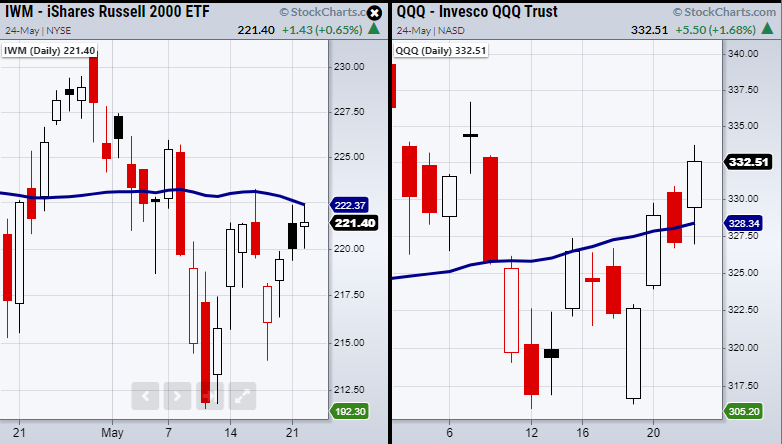
Additionally, the tech-heavy NASDAQ 100 Invesco QQQ Trust (NASDAQ:QQQ) cleared its 50-DMA. The next test is for both symbols to hold their MAs as support for today's trading session.
Because both have consolidation from recent weeks and mid-March around the same price area, this makes a move over the 50-DMA much more meaningful.
On the other hand, while the small-cap index Russell 2000 iShares Russell 2000 ETF (NYSE:IWM) was poised to clear its 50-DMA, its recent trading history shows how finicky it behaves around its major MA price level.
A better way to view IWM would be from its main trading range which is roughly from $214 – 226. Furthermore, if IWM can clear this range, it will show that the large-cap and small-cap companies are aligned for a move higher.
With that said, the market has one more thing to worry about besides breaking specific price levels: the U.S. Personal Consumption Data report that is set to release Thursday. The report helps the Fed track inflation and can give investors an idea of what to expect through the coming year.
Because inflation has been a touchy topic for the general market, it could be a leading cause for increased volatility towards the end of this week. It also can hinder price movement as investors trade cautiously before the report is released.
Gold and silver continued to shine. In the inflation narrative, gold could begin to overtake copper in performance. Should that occur, it could imply that the economic recovery is abating while inflation picks up. That equals stagflation.
Again, watching the Russells is the window into which way our economy will head over the next quarter or two.
ETF Summary
- S&P 500 (SPY) Resistance at 422.82.
- Russell 2000 (IWM) Support 215. Resistance at 222.44 -226.
- Dow (DIA Needs to clear 345.
- NASDAQ (QQQ) Watching for a second close over the 50-DMA at 328.38.
- KRE (Regional Banks) 71.82 resistance. 68.21 support.
- SMH (Semiconductors) Needs second close over the 50-DMA at 242.07.
- IYT (Transportation) Flirting with the 10-DMA at 273.01.
- IBB (Biotechnology) 147 support.
- XRT (Retail) Struggling to hold over 91.
- Volatility Index (VXX) 36 next support.
- Junk Bonds (JNK) Resistance at 109.17.
- XLU (Utilities) 65 support.
- SLV (Silver) Doji day. 24.92 next support.
- VBK (Small Cap Growth ETF) 277.21 resistance.
- UGA (US Gas Fund) 34.68 resistance area.
- TLT (iShares 20+ Year Treasuries) Watching for second close over 137.67.
- USD (Dollar) 90.14 resistance.
- MJ (Alternative Harvest ETF) Holding over the 10-DMA. Needs to clear 20.48 next.
- LIT (Lithium) 64.25 resistance.
- XOP (Oil and Gas Exploration) Held over the 10-DMA at 86.15.
- DBA (Agriculture) 18.17 support. Head and shoulders chart pattern.
