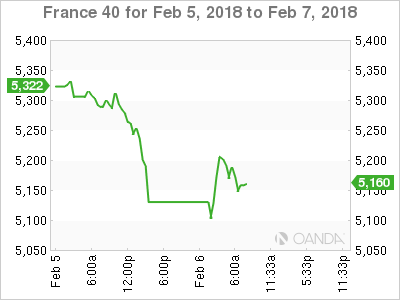
The CAC index has posted sharp losses in the Tuesday session. Currently, the index is at 5141.70, down 2.70% on the day. On the release front, there are no key indicators on the schedule. France’s deficit dropped sharply to EUR 67.8 billion, down from the previous reading of EUR 84.7 billion. This marked a 6-month low. Eurozone Retail PMI dipped to 50.8 in January, down from 53.0 in December. On Wednesday, France releases Trade Balance, which is also expected to show a smaller trade deficit.
Global stock markets are seeing red, and the CAC continues to slide. The index lost 3.1% last week and has declined another 2.9% this week. US markets took a tumble on Monday, with the Dow Jones posting its biggest loss in one day – at one stage, the index was done 1500 points. The Dow fell 4.6% on Monday, and the downward trend has continued in the Asian and European markets on Tuesday. As investors head for the hills, analysts are scrambling to find the reasons behind the massive sell-off. Some experts are pointing to the changing of the guard at the Federal Reserve, with Jerome Powell replacing outgoing chair Janet Yellen on Saturday. However, Powell is not expected to change current monetary policy, so it’s unclear how Powell would have rubbed the markets the wrong way after just one day at his new job.
More likely, the stock markets woes can be attributed to strong US nonfarm payrolls and wage growth reports, which were released on Friday. Investors fear that the sharp data could lead to higher inflation, which in turn would result in more rate hikes this year. Higher interest rates make the dollar more attractive for investors, at the expense of the stock markets. Adding to investors’ concerns, there are expectations that the ECB and possibly the Bank of Japan could raise rates late in 2018, which would push up the euro and yen and weigh on the stock markets.
Algo Trading Blamed for Monday’s Market Crash
Dow Suffers Biggest Ever One Day Points Loss
The French private sector has started 2018 on high note, as the services sector continues to expand at a brisk pace. January’s Services PMI was strong, as the indicator edged up from 59.1 to 59.2, just shy of the estimate of 59.3 points. Business confidence remains the strongest since 2011, as businesses are optimistic about strong global economic conditions. The manufacturing sector has also showed strong expansion, boosted by global demand for French products.
Economic Calendar
Tuesday (February 6)
- 2:45 French Government Budget Balance. Actual 67.8B
- 4:10 Eurozone Retail PMI. Actual 50.8
*All release times are GMT
*Key events are in bold
CAC, Tuesday, February 6 at 7:20 EDT
Open: 5,118.25 High: 5,224.50 Low: 5,113.50 Close: 5141.70

