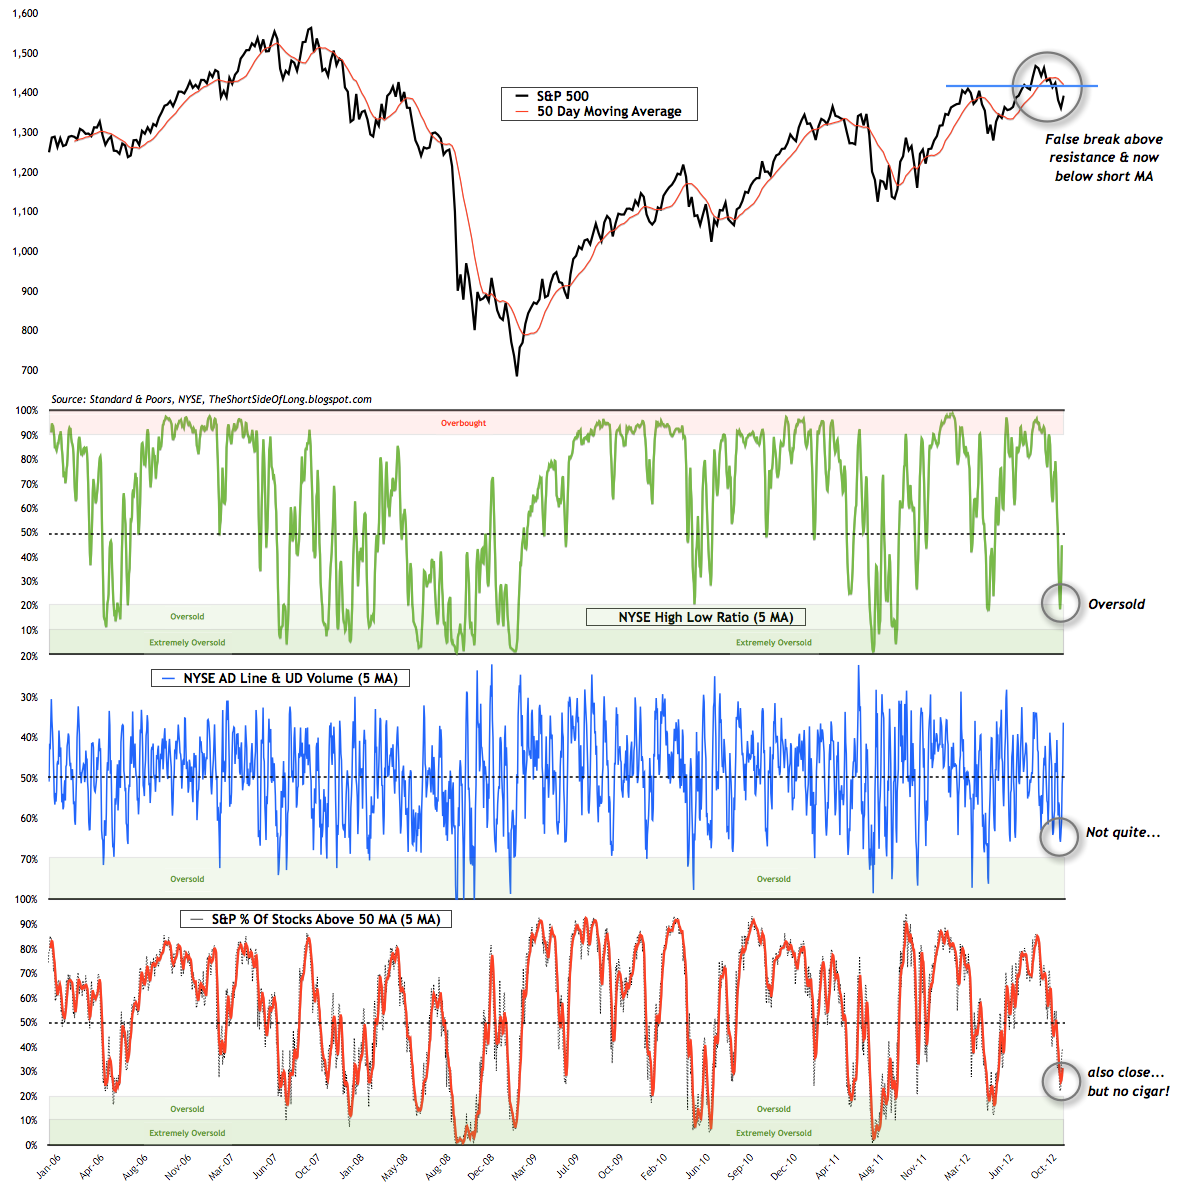
If you haven't heard the news already, the bulls have declared victory. Various bloggers around the internet have posted articles titled The bottom is in, Waiting for Santa Claus rally and Major buying opportunity (plus many others). The first note in Saturday's post warned that all in all, one could make an argument that a bounce or relief rally might be in store soon and that is what we have gotten so far. However, I'm personally not expecting anything remotely close to "a major buying opportunity... just yet. While there are many reasons for this, the chart above which tracks short term market breadth internals, shows that the market didn't really experience a proper oversold condition. We only became slightly oversold with Net New Highs, while the AD Line & Volume as well as the Stocks Above 50 MA never really washed out properly. Many will ask, why is it import to get oversold? Extreme oversold conditions create panic selling and re-build the wall of worry by removing weak hands from the market. These occurrences are necessary to forge longer term lasting supports as anything less usually fails.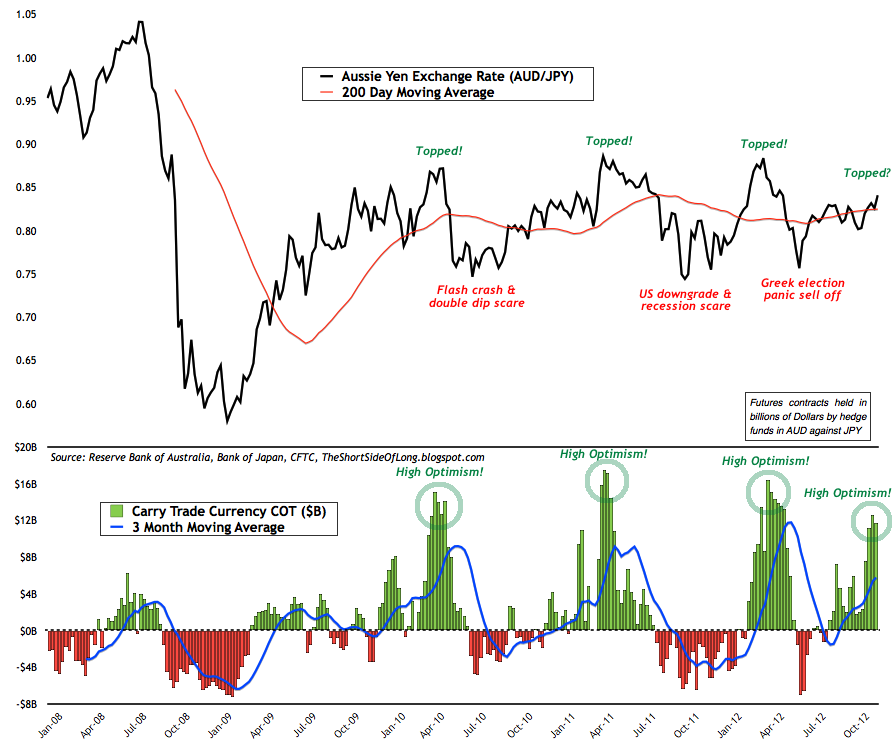
Within the foreign exchange world, the Australian Dollar Japanese Yen cross pair is commonly known as the risk barometer or a perfect example of the carry trade concept. In recent years, this trade has been a great signal of market sentiment as it ebbs and flows from pessimism to optimism and back to pessimism again. As of last Friday, the CFTC commitment of traders report showed that hedge funds are currently extremely long the Aussie and extremely short the Yen. Furthermore, since that report was complied two Tuesdays ago, on the 13th of November, the recent price action has been very negative on the Japanese Yen. Therefore, one could assume that hedge funds have increased their bearish Yen bets and pushed the Carry Trade COT towards further extremes. Similar events occurred in April 2010, May 2011 and March 2012 with a result of a sharp and swift sell off (in all risk assets). I eagerly await the new CFTC report today to see further hedge fund positioning developments in both the Aussie and the Yen.
Gold Volatility measured by the GLD CBOE VIX is at record lows (video above). As a matter of fact, volatility all around the world has fallen dramatically. The S&P 500 VIX is around 2007 lows, the DAX 30 volatility is amazingly low, Hang Seng Volatility is also at multi year lows and finally the JP Morgan G7 currency volatility is as low as 2007 as well. Implied volatility for stocks, corporate bonds, junk bonds, currencies and commodities is just dead quiet. Skew indices for various currency crosses shows that bulls are paying premium costs for Calls. The Euro Dollar option skew is very elevated with Calls almost as cheap as Puts. In similar fashion, the Dollar Yen option skew is actually showing record premium being paid for the U.S. Dollar rising. With volatility dramatically low on almost all risky asset classes and bulls paying premium for Calls in the options market, one should apply a lot of caution moving forward.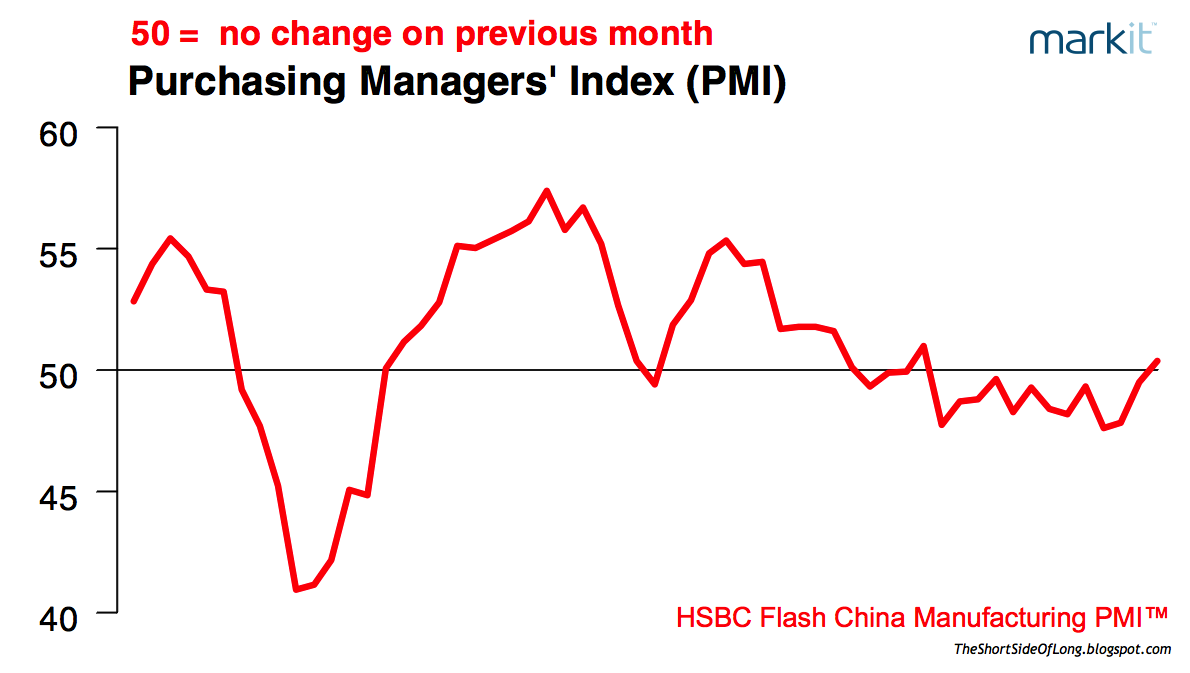
As far as I am concerned, one of the major conundrums in the market today is the so called Chinese economic recovery we are constantly being bombard with by various media outlets. This morning in Asia during work, I noticed Bloomberg reported that Chinese manufacturing index signaled the first expansion in 13 months, adding to signs that economic growth is rebounding after a seven-quarter slowdown (chart above). Poking further in-depth I checked out the report and read Mr Qu's comments (Chief Economist at HSBC): As November’s flash reading of HSBC manufacturing PMI bounced back to the expansionary territory for the first time in 13 months, this confirms that the economic recovery continues to gain momentum towards the year end. The conundrum occurs with the lack of enthusiasm out of the financial markets. Just think about the conditions for a second. Chinese manufacturing expands for the first time in 13 months and Shanghai Composite continues its selling for yet another day? Whether we look at the price of Copper or the current level of the Korean KOSPI or the Shanghai Composite itself, it is impossible to see a Chinese recovery in the price. Let us remember that the majority of the time, markets act as a discount mechanism as they price in events up to 6 months ahead, therefore these markets should have front run todays data well in advance. During a real recovery in 2009, prices of Copper and KOSPI were rising rapidly, almost without a pullback. So why is there a lack of enthusiasm today? You will notice that the KOSPI and Copper both reversed all of their recent gains. Is the market doubting the Chinese recovery? One thing is for certain, while not perfect by all means, I rather trust the market than Chinese official statistics.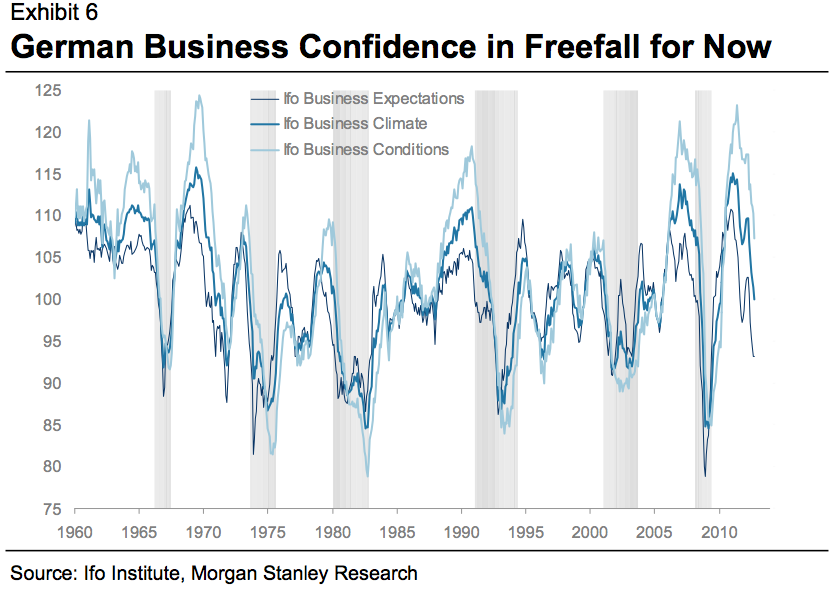
- It has been my view for awhile now that global economies continue to slow as we are moving toward another recession. First it was the peripheral Eurozone countries (PIGS) that started slowing due to the financial crisis in 2010/11 and it wasn't long before the majority of the EU became affected in later parts of 2011. Afterwards it was Europe's largest trading partner China that started feeling the effects of a slowdown in 2012 and as China slowed the majority of Asia followed. One of China's biggest trading partners and the world's third largest economy - Japan - has now experienced a dramatic five month decline in exports and has become the latest economy edging toward a recession as we start 2013. The chart above, thanks to Morgan Stanley Research shows that German Business Confidence is now in free fall (something we have been covering here on the blog for awhile). MS research writes: "Germany might not be able to avoid a recession either - While we continue to expect the German economy to outperform the euro area as whole and expand by an average 0.3% in 2013, we worry that economic activity might contract over the winter. Not only is export demand (notably from the euro area) deteriorating sharply, but German companies are also embarking on large-scale cost-cutting programmes. Alas, consumer spending is not dynamic enough yet to compensate for the shortfall in external demand and investment spending." I also eagerly await the new Ifo Institute report today, which should give us further clues on what 7,000 German CEOs are currently experiencing.
I hold a view that the equity market is putting in an important longer term top. I have held this view since at least July of this year, warning that the rally in the S&P 500 from 1266 on the 01st of June is most likely the last push higher and will eventually fail. So far we have given back half of those QE gains, but the bulls are quick to point out that this was only a temporary pullback due to Fiscal Cliff worries. While they expect higher prices, my personal view is that the business cycle expansion is coming close to an end and here are some major warning signals: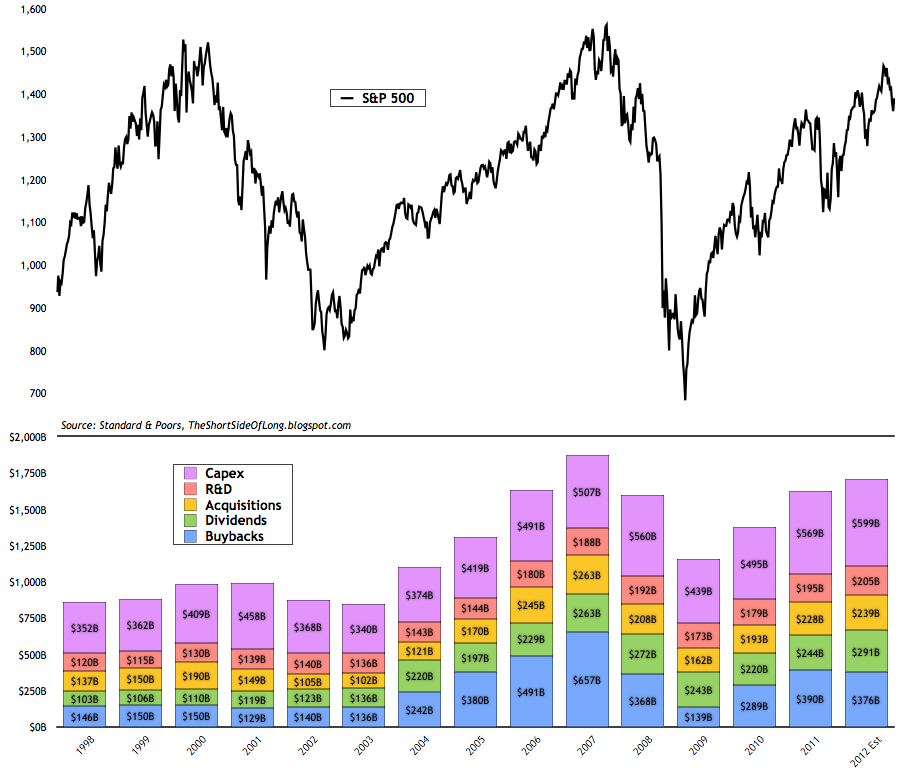
Data published by Standard & Poors shows that U.S. corporate activity is edging above 1.7 trillion dollars. This type of balance sheet expenditure is only second to 2007, when corporations spent almost 1.9 trillion dollars. Of course, spending is always highest near equity market tops and close to the end of expansions, just prior to a recession. We can see a similar picture in 2000 and 2007.
Furthermore, if one is paying close attention, it is easy to notice that current capital expenditure (capex) investment is now at a record high, overtaking the 500 billion dollar spending spree last seen in 2007, just at equity markets around the world were topping.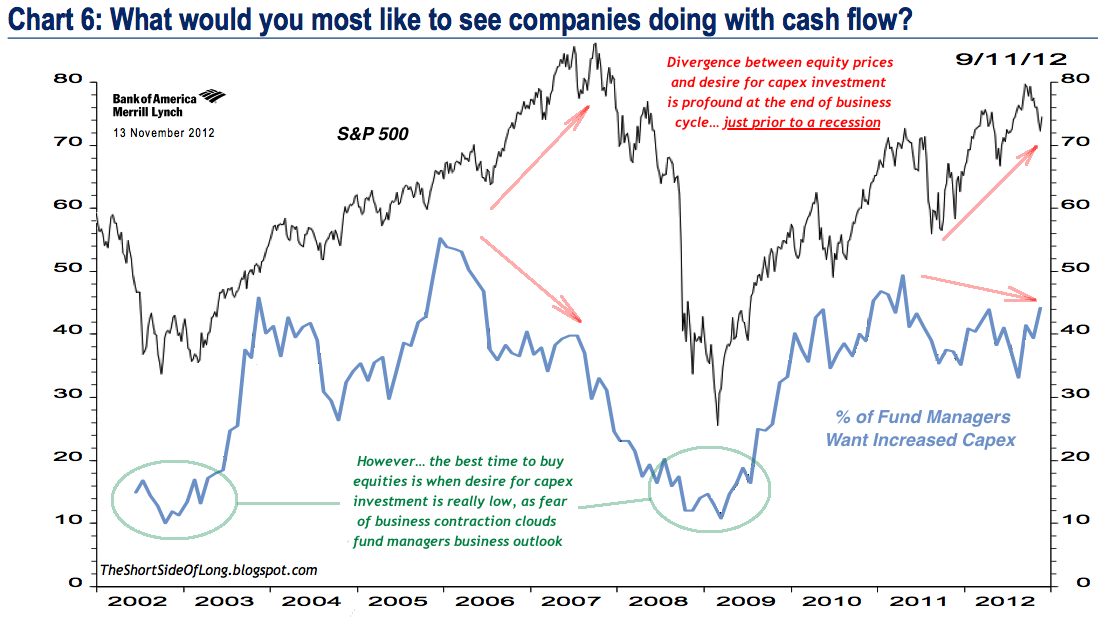
In the recent Merrill Lynch Fund Manager Survey, when asked "what would you most like to see companies doing with cash flow?", almost 50% of global fund managers stated they would prefer an increase in capex. As the chart above shows, the desire for capex investment has now stayed elevated for the whole of 2010, 2011 and 2012. Last business cycle saw the capex investment desires by fund managers remain elevated from 2004 to 2007. So, in that regard, the current business cycle is aged and most likely coming to an end. More importantly, while capex investment itself is already breaking the 2007 record, fund managers outlook now seems to be diverging with the price of equities.
Why aren't managers desiring further capex investment as equities rise sharply in recent quarters? Could it be that equities are rising for reasons other than fundamentals? A similar occurrence was seen during the end of the last business cycle, where equities rallied euphorically higher on outright share buybacks (as well as the Fed's rate cuts), ignoring the fundamentals. It seems that history is repeating itself... yet again.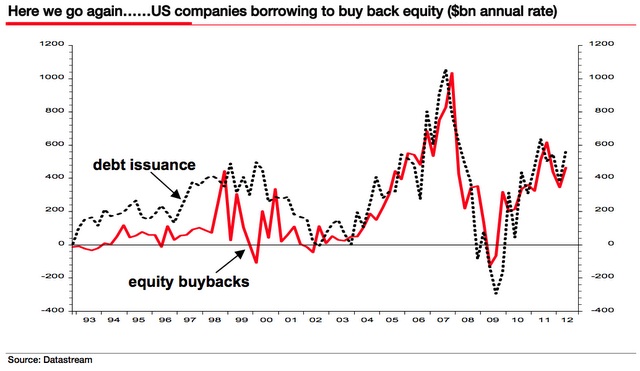
In his recent newsletter, Albert Edwards warns that the current debt issuance by corporations has been solely used for equity buybacks, which is an extremely worrying sign for those currently invested in equities. And I quote:
We look at the recovery in the credit aggregates and find all that is happening is that US corporates are once again engaging in their bad old destructive practices. For despite all the talk of cash rich U.S. corporates, that has not stopped them returning to the credit markets to leverage up their balance sheets even more -- spending the proceeds, almost dollar for dollar on equity buybacks (see chart). History suggests this always ends badly. Maybe this time will be different, but I fear otherwise."
Further into the newsletter Mr Albert's colleague, Andrew Lapthorne, makes a great point:
We know that buybacks are contrarian indicators, occurring at the top (and not the bottom) of the market. Why, we ask, are companies leveraging up now and not 12 months ago, when equity prices were much lower?
We conclude that (contrary to what we read), U.S. dividend payments are not enjoying a revival relative to cash flows and that buybacks remain the distribution channel of choice for corporates wishing to boost EPS and limit the effects of option dilution.
A buyback in this form is not a return to shareholders, -- it’s called gearing or balance sheet risk and will come to haunt some firms when the economy enters a downswing.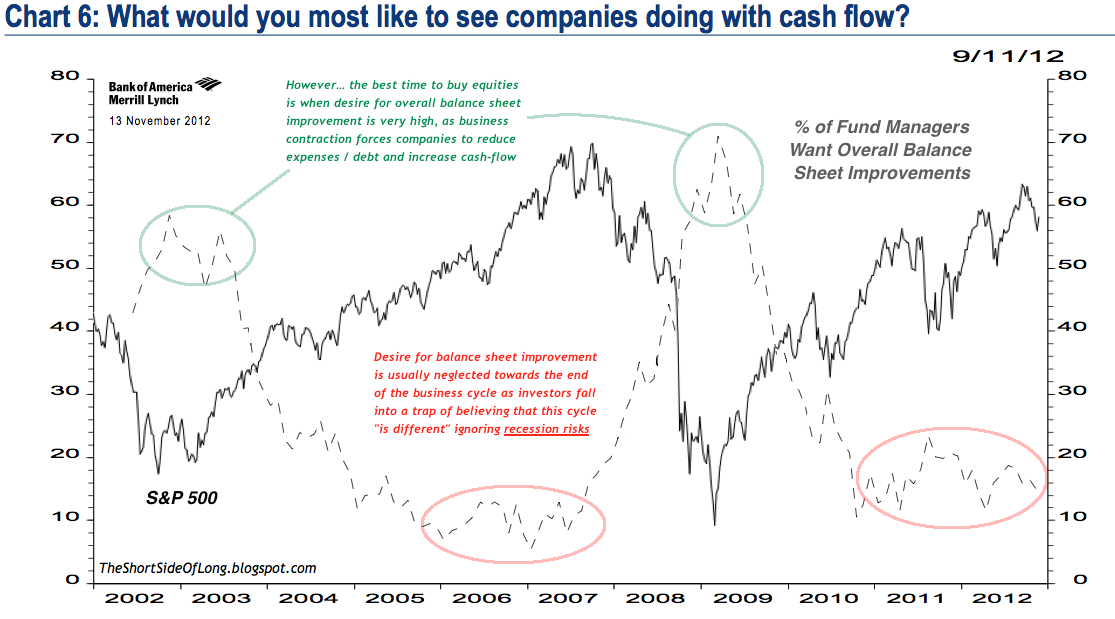
With leverage once again entering the system, it seems corporations have not learned too many lessons from 2008 -- and neither have fund managers. When the Merrill Lynch Fund Manager Survey asked "what would you most like to see companies doing with cash flow?", only 14% of global fund managers stated they would prefer to see an improvement in balance sheets. Only 14%... and these readings were as low as 11% in March of this year! As the chart above shows, desire for balance sheet improvement is only ever in full force when absolute panic and fear sets in, as corporations pay for their "gearing / leveraging" mistakes during the upturn in the business cycle. I'm afraid those are waiting for us just around the corner.
Sober Look's blog recently did a great summary of posts regarding the business cycle equity and debt issuance and pointing out that there is now an enormous amount of corporate leverage in the system with too much money chasing too few assets. High yield debt issuance, leveraged loan funding and total equity offerings including IPOs have all achieved record high levels (chart below).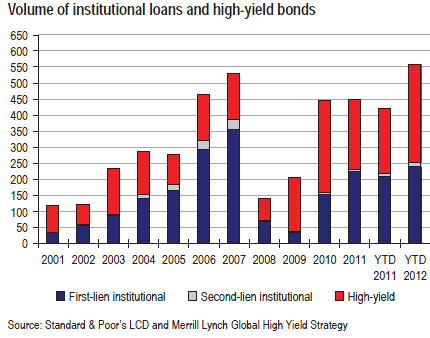
The current data is definitely showing warning signals that we are approaching a major equity market top. Be it record corporate spending on capex, complacency by fund managers neglecting balance sheets, record issuance of junk bond debt, leveraged loan funding and total equity offering including IPOs like Facebook -- all most likely mark a huge contrarian signal to sell.
In hindsight the current call I am making here, with a view of a bear market and recession directly ahead, will look like an easy one. In a few quarters from now, the majority will claim that they have also picked the top, they all forecasted a recession and they all protected their portfolios... but this will be as far away from the truth as possible. Today, wherever you look and whatever you read, the majority of investment bank analysts, Wall Street strategists, newsletter writers, internet bloggers and retail investors see no reason to panic. Furthermore, the majority expect higher equity prices in the months ahead as growth picks up.
Even Federal Chairman Dr Ben Bernanke himself thinks that 2013 can be a fabulous year, if only politicians can make a quick deal on the Fiscal Cliff. My conclusion to the current consensus outlook is that the recent equity market decline has nothing to do with the Fiscal Cliff. I foresee a totally opposite outcome in 2013 and I personally think that Chairman Bernanke's recent speech at the New York Economics Club will prove to be a great contrarian indicator.
For those willing to do extra reading, please consider Sober Look blog links:
- High yield debt issuance in 2012 hits an all-time record
- Another record month for leveraged loan funds
- Total equity offerings in the US hit an all-time record
- Economic Outlook: The global economy continues to slow towards a recession, as we find ourselves in the very late cycle of the expansion. United States growth remains below 2% for five out of the last six quarters, with durable goods new orders collapsing recently. The Eurozone remains in a recession, as Germany dangerously flirts with a contraction in growth. German CEOs see the business cycle moving deeper into a downturn with a high probability of recession. Japanese growth rates are once again anaemic post the earthquake recovery, with Industrial Production slowing meaningfully. Chinese growth continues to slow for the seventh quarter in a row, however many do not believe official growth data. Business confidence is decreasing rapidly, while the manufacturing sector has been in a doldrum for a year, confirmed by the slowest electricity consumption since 2009. More importantly the price of cement, iron ore and steel has crashed recently, indicating the end of the property building boom. Finally, exports are now slowing rapidly, while railway cargo freight is looking very weak.
- Equities: Short positions are held in various US equity sectors, which include Dow Transports (IYT), Technology (XLK), Discretionary (XLY) and Industrials (XLI). Large put options have been bought on Apple (AAPL). Call options have been sold on Homebuilders (XHB), JP Morgan (JPM), Amazon (AMZN), IBM (IMB), Commonwealth Bank (CBA), Adidas (ADS) and others.
- Bonds: There isn't a lot of exposure in the bond space, as we believe this sector is experiencing euphoric investor demand. Call options have been sold on Junk Bonds (HYG). We plan to short Long Bond Treasuries (TLT) in due time.
- Currencies: Long positions are held in Japanese Yen (FXY). Put options have been bought on British Pound (FXB) & Canadian Dollar (FXC). Put options have been sold on Japanese Yen (FXY).
- Commodities: Long positions are held in various commodity sectors, which include Silver (SLV, SIVR, PSLV, Comex futures), Agriculture (RJA, JJA) and Sugar (SGG). We plan to increase longs in PMs and Softs in due time.
