Some says that “Tina” has come back !! [There Is No Alternative] … in fact the only one direction in Financial Market in this 2019, has been in up-trend !
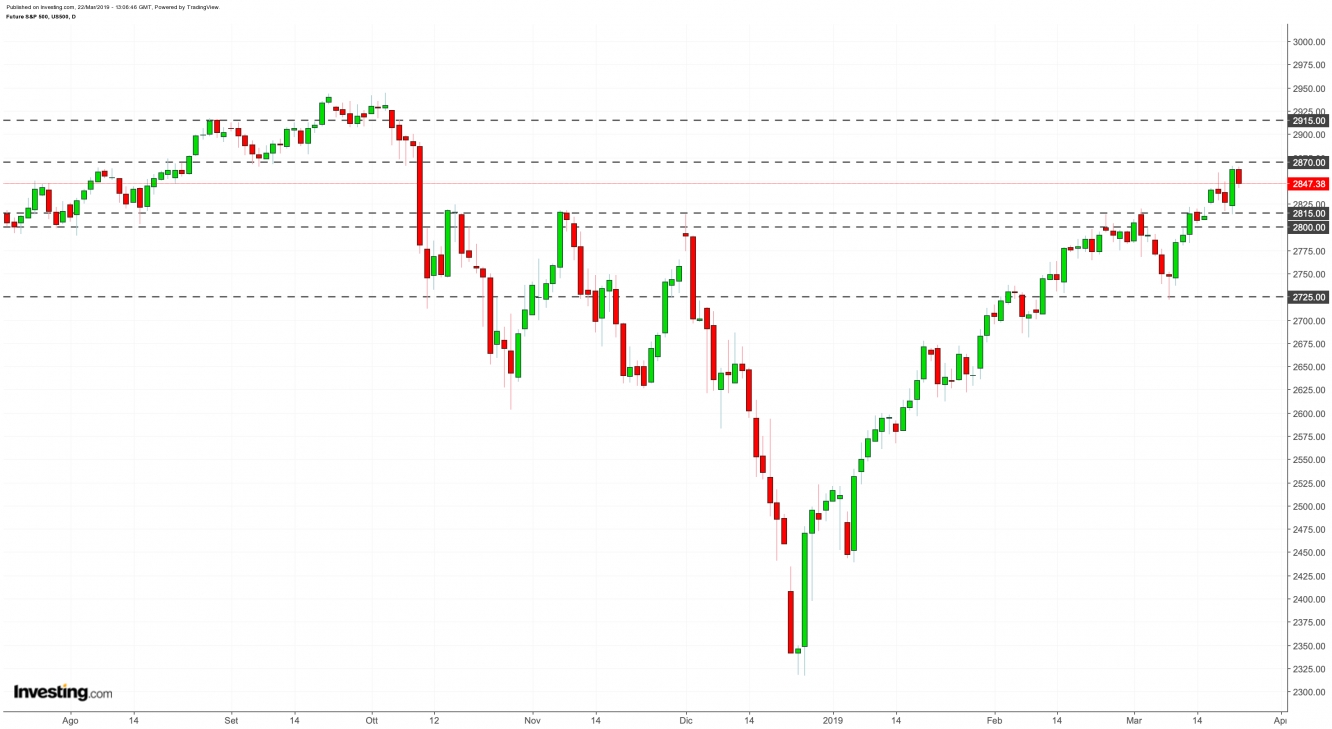
The reaction from the bottom of last year, continue to be strong. This rebound, after the shock on last quarter 2018, has performed over +20% . In this week a Dovish Fed, and President J. Powell, have given the chance to push again on “buy”, updating the top of 2019.
We’ve to remind that the absolute maximum on S&P500 aren’t so far, about 2.5%.
So the question is: we’ve to attend the break-up over the top in this 2019 ?
In this first part we can analyse the movement of S&P 500 (Future), where:
- the rebound has been considered in this way until the break of area 2800-2815 points. Infact in this area, the price has crated a little flag-area with a volatility’s fade.
- in the next step, the market has confirmed the strength going to update the relative maximum, thanks to the last update by FED.
- At this time, the next possibile target is about in area 2870 point first and 2915 in second step.
- Only the break-up of this last price, would confirm the extraordinary power of market. In this case, the probability to see an new update of historical maximum could reach highest level from latest months.
Which area would recall a bear market ?
Well, actually is the last scenario as possible to realise, for all written above.
But if we put our focus on chart, only a weekly closing under the last important bottom, relative to 8th march 2019, could confirm the quit on bull market.
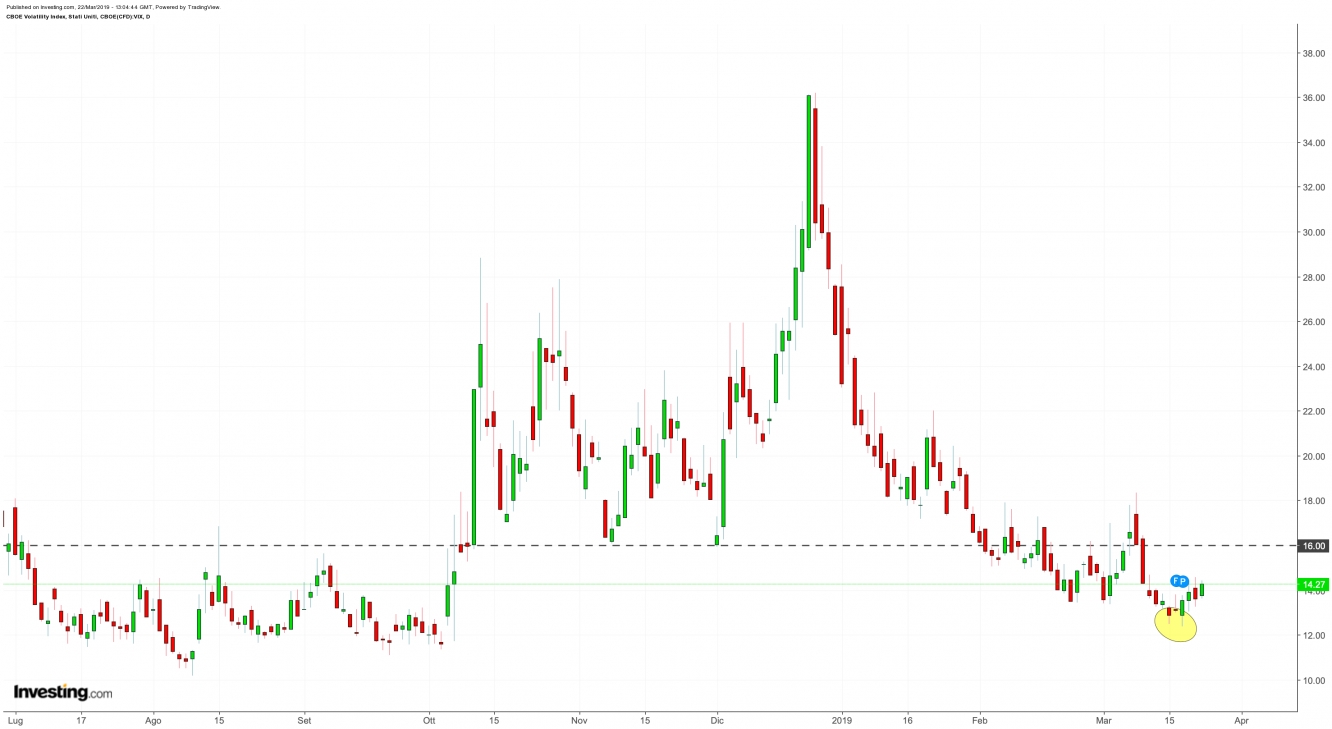
Added to this view we can also analyse the Volatility Index chart. Infact in this way, today we can see a significant minimum realised on 15-19 March 2019. So, a bullish day on Vix could provide an input to speculate short on Equity Market in short term. Another important point is a close daily over 16 points.
Note: as like as using an indicator, or better a momentum indicator, where searching the Divergence standard, we can also obtain some information by Vix's chart, but only the price could confirm or not the possible start of an inversion on stocks market.
Last thing: we can read the volume and COT report for catch some other infomation on net position by traders. Many analysts in the latest weeks have underlined that there's been an important cash outflow from equity market in these firts weeks of year. That's all, and we can fight the actual trend ? I think not. In my opinion, we can’t anticipate the movements on markets without a test on key level and a reversal technical pattern . Common Error for many Traders Retail is this: they wanna start to accumulate short positions. But you know, the market is "the beast that never give up."


