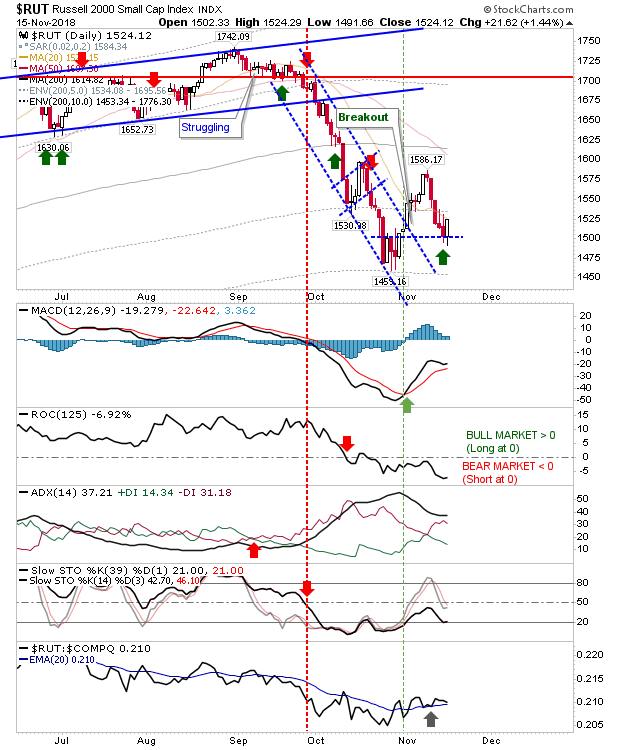
The developing (major) swing low got a big boost with another sizable wide range, bullish piercing pattern - similar to the bullish reversal candlestick from October 31st. Again, cautious investors who have been buying the extremes should still be active, particularly in the Russell 2000. Yes, new lows are possible, but nobody can predict the future and you can only act on the present - and now is a good buying opportunity.
The Russell 2000 was able to defend the mini-congestion zone from the end of October (the horizontal, blue hashed line). Rate-of-Change is still in the bear zone but relative performance is still positive and the MACD is clinging to a 'buy' trigger.
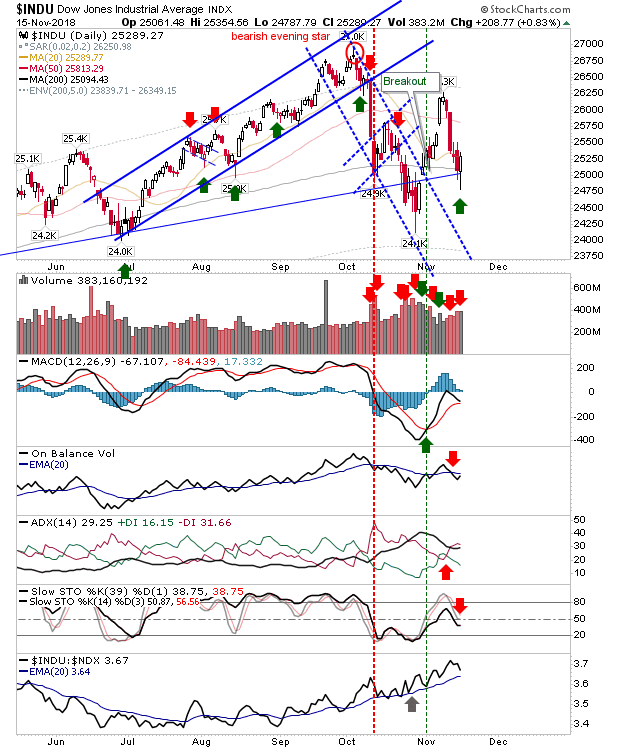
The Dow Jones Index dug in at its 200-day MA, which was also a former trendline support level and higher volume accumulation. The MACD is still positive but other technicals are negative and not yet at levels which themselves could confirm a bottom. However, this still looks buy-worthy.
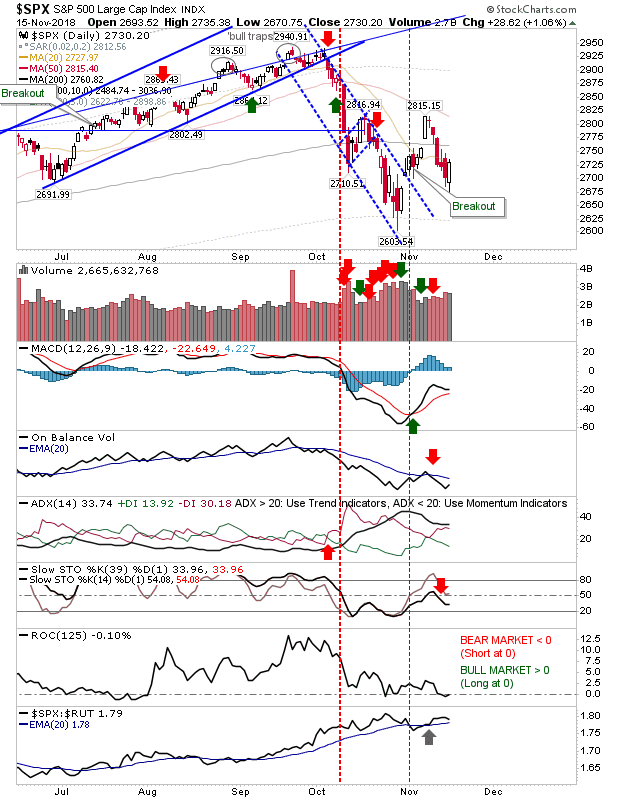
The S&P 500 has a support level to work as prices recovered from the congestion of October lows. The question is whether there is enough momentum to push beyond overhead moving averages, the first of which is the 200-day MA. Again, traders should be liking this as a buying opportunity.
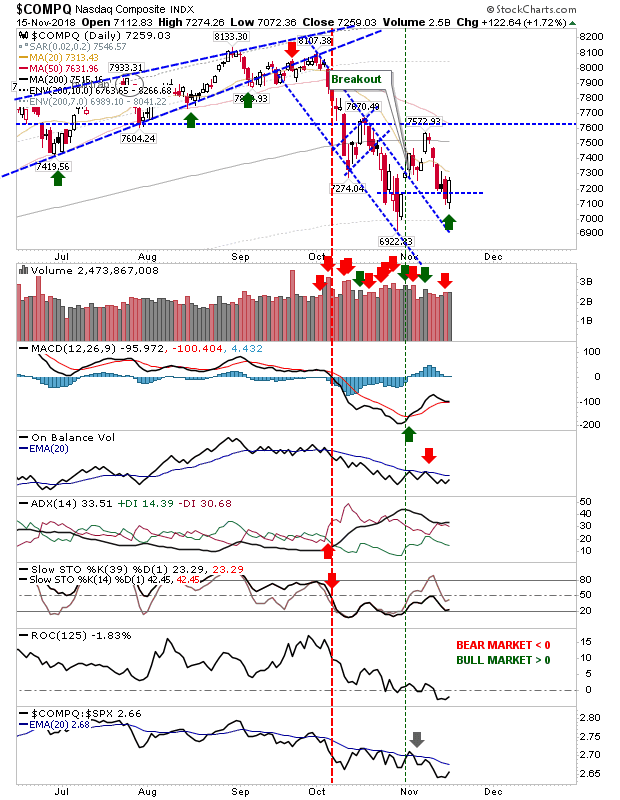
The NASDAQ Composite overstepped a little on congestion support but did manage to close above such support. The NASDAQ was unusual in of the three main averages I track it didn't enter the long-term investor buying opportunity which the S&P 500 and Russell 2000 achieved. Given that, there is still a buying opportunity here; short-term traders can use today's low as a stop (7,072) and play for a move to reach 7,570 and 8,000.
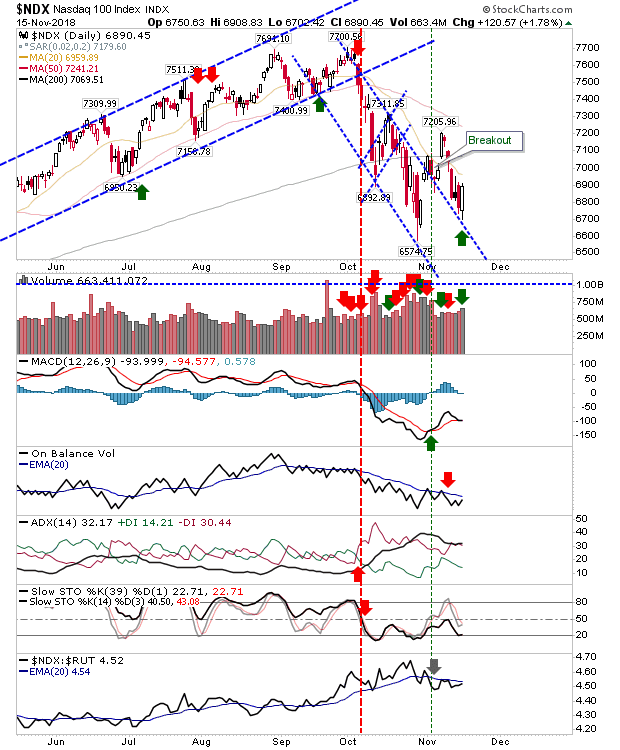
The NASDAQ 100 is at former channel resistance (now support). This is nicely placed for a bounce with a stop on a loss of 6,700. The MACD is on a 'buy' trigger as other technicals remain on 'sell' triggers.
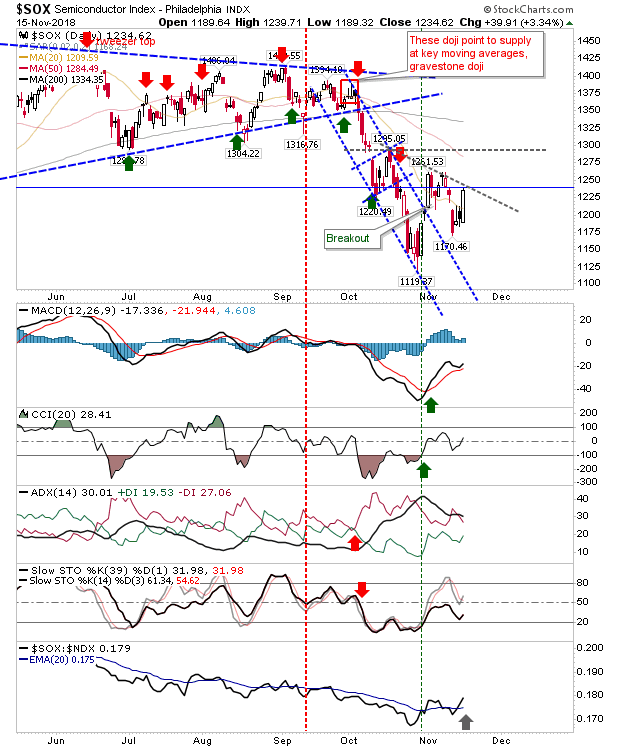
The Semiconductor Index managed the biggest bounce of the indices I track. Technicals are in a little better shape and relative performance is good. This is better news for the NASDAQ and NASDAQ 100. I would be looking for confirmation breakouts of the grey-hashed line to suggest similar moves will kick in for the NASDAQ and NASDAQ 100.
In summary, today's bullish piercing patterns offer good buying opportunities across all the indices. Any easing back into today's candlestick offers a fresh buying chance, but if it oversells by two-thirds then the risk of the piercing patterns failing markedly increases.
