Building a “market portfolio” has obvious benefits for portfolio design. The asset allocation is relatively objective in the sense that Mr. Market chooses the weights. History suggests this is a competitive strategy. Even if it’s not slavishly followed, market weights can be useful for guidance in portfolio design and management. But the necessary task of estimating market values can be problematic, especially if the portfolio includes so-called alternative asset classes and strategies. A possible solution: using a statistical factor model to estimate a market portfolio.
One methodology is based on principal component analysis (PCA), a modeling application for estimating factor weights. Using only returns, PCA decomposes the portfolio and spits out the weights that correspond to the “market” portfolio. Specifically, the first factor portfolio via PCA – the one with the highest variance — tends to capture the primary beta that drives risk and return for a given set of assets. The resulting mix typically corresponds with what we think of as the market portfolio.
Why might you consider analyzing a set of assets with this approach? Several reasons, starting with efficiency and simplicity. Instead of estimating market values for all the assets, which can be cumbersome and prone to error, PCA offers a clean, efficient tools for determining market-related weights. Using R, for instance, provides a quick means for generating PCA data.
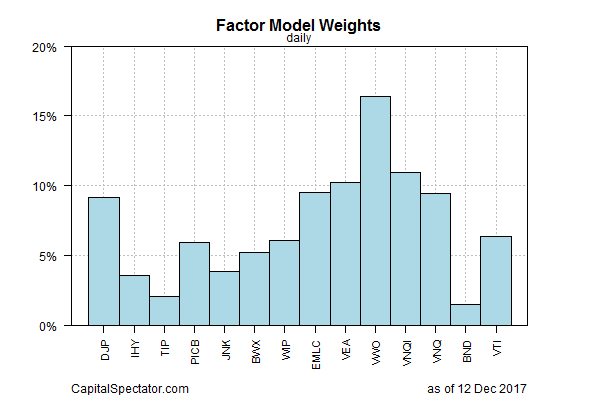
For example, consider how a set of ETFs representing the major asset classes stack up. Decomposing factor weights based on daily returns for the past year produces the following set of weights.

The results are somewhat surprising. Note, for instance, that the PCA analysis based on yesterday’s close (Dec. 12) gives the biggest weight (roughly 16%) in the portfolio to NYSE:VWO, an emerging-markets ETF. Domestic and foreign real estate (NYSE:VNQ and NASDAQ:VNQI, respectively) are also given relatively high weights. US equities (NYSE:VTI), by comparison, receive just 6%.
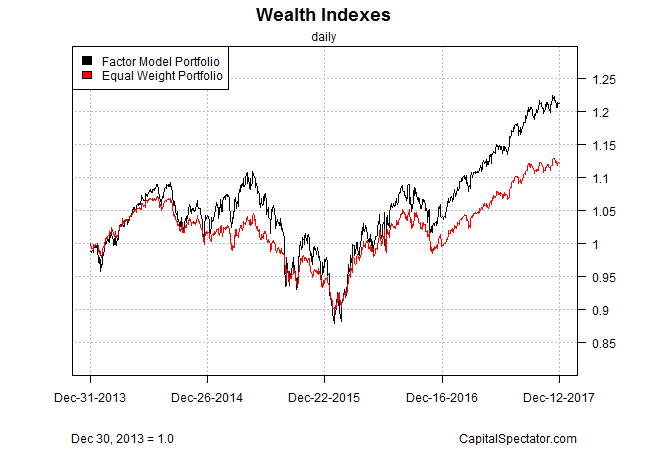
The next chart shows how the year-end rebalanced PCA-based market portfolio performed relative to an equal-weight mix of the same ETFs.

Using PCA for guidance on portfolio design isn’t a silver bullet, but it offers intriguing possibilities for analysis. For instance, if you’re incorporating several alternative asset classes and/or strategies in a portfolio it may not be obvious how to efficiently weight the funds/securities. Long/short strategies, hedge funds, and commodities, for instance, don’t easily lend themselves to standard market-value weighting analysis. PCA, by contrast, offers a powerful tool for developing perspective on how much to allocate to these areas if the goal is to approximate a market-oriented portfolio.
In a future post, I’ll explore how PCA-based market portfolios compares to a conventionally designed strategy using market values.
