Get 40% Off
👀 👁 🧿 All eyes on Biogen, up +4,56% after posting earnings. Our AI picked it in March 2024.
Which stocks will surge next?
Unlock AI-picked Stocks

Bitcoin Volatility Draining Away

Published 06/07/2021, 01:16 PM
Updated 07/09/2023, 06:31 AM

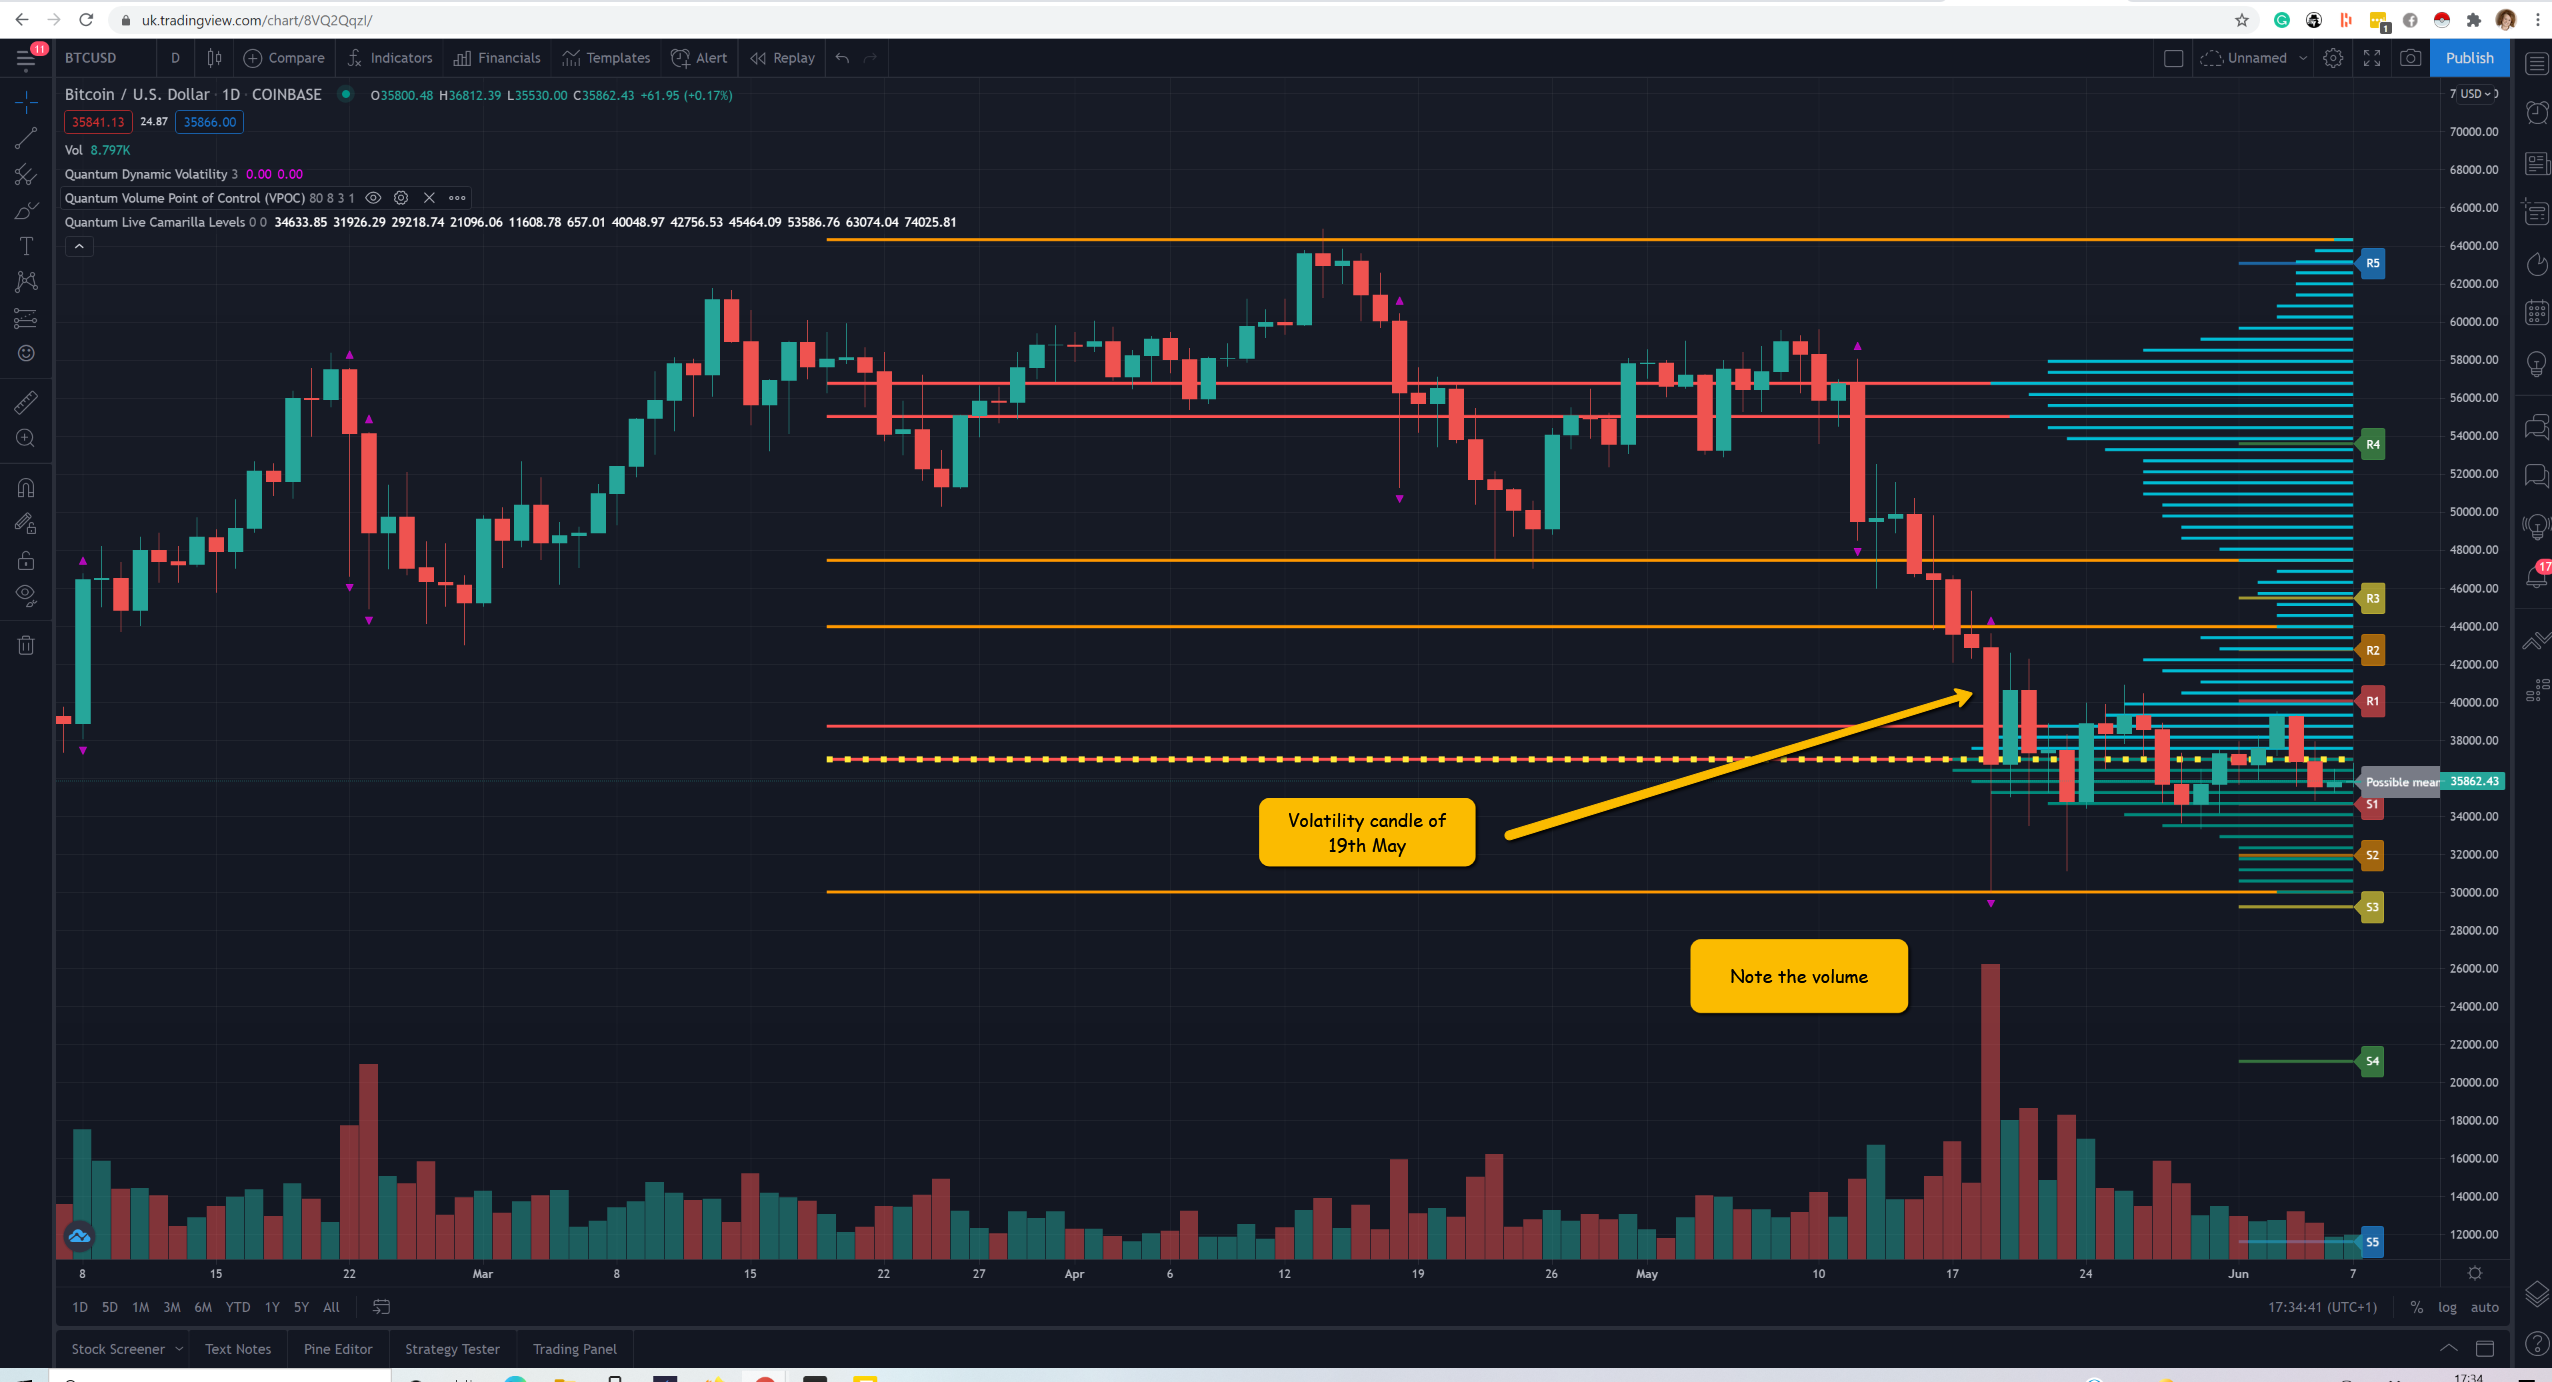
Bitcoin Daily Chart.

Traders and investors are all familiar with the concept of volatility. At its simplest level, it is nothing more than the compression of time. Price action that might normally occur over hours happens in minutes or seconds. However, if there is one market that exhibits greater levels of volatility than any other – and for many reasons – it is the cryptocurrency market.

However, for Bitcoin, we have seen volatility drain away in the last three weeks as the price congests in a relatively narrow range around the 36,000 to $37,000 area. The question is why. That can be answered by considering the daily chart and, in particular, the price action of May 19. Two significant events occurred on that day.

First, we had the volatility indicator trigger with the small purple triangles at the top and bottom of the candle. That indicator reveals the moment the price action moves outside the average true range (ATR) for the market and timeframe and is triggered in real-time. As a result, we can expect one of two things to happen. Either a reverse in the trend or congestion within the spread of the candle. It is the latter we are seeing at present.

Second, this volatile candle was associated with extreme volume. And given the depth of the wick to the lower body of the candle along with the volume, we can infer this is buying based on the first principles of volume price analysis with further buying arriving four days later.

3rd party Ad. Not an offer or recommendation by Investing.com. See disclosure here or remove ads .

So what next?

For now, it is a question of being patient and waiting for the price action to clear the volatility candle. Only then are we likely to see a trend develop. This analysis is further reinforced by the fact Bitcoin is trading at the volume point of control, between the R1 and S1 levels on the Camarilla levels indicator, aka the buffer or neutral zone, thereby confirming the current congestion phase. The current stagnation in the price action will end once Bitcoin breaks through either the key S3 and R3 levels, which are just beyond the high and low of the volatility candle itself.

Latest comments

So it will go up or down. Thanks!
won't survive
It's price is draining away. It's volatility is built in.
BTC is dying out ! No future at al ! It won't be it that will replace USD
Until 2 am pacific time Tuesday morning
"For now, it is a question of being patient and waiting for the price action to clear the volatility candle. Only then are we likely to see a trend develop. This analysis is further reinforced by the fact Bitcoin is trading at the volume point of control, between the R1 and S1 levels on the Camarilla levels indicator, aka the buffer or neutral zone, thereby confirming the current congestion phase. The current stagnation in the price action will end once Bitcoin breaks through either the key S3 and R3 levels, which are just beyond the high and low of the volatility candle itself."  This doesn't make you sound smart. This makes you sound like you filled out a word count total on a school essay. Price dropped because trump said something stupid. Price dropped because elon said something stupid. Price dropped because a few people own most bitcoins and manipulate the market. Price isn't changing based on "camarilla level indicators".
Risk Disclosure: Trading in financial instruments and/or cryptocurrencies involves high risks including the risk of losing some, or all, of your investment amount, and may not be suitable for all investors. Prices of cryptocurrencies are extremely volatile and may be affected by external factors such as financial, regulatory or political events. Trading on margin increases the financial risks.
Before deciding to trade in financial instrument or cryptocurrencies you should be fully informed of the risks and costs associated with trading the financial markets, carefully consider your investment objectives, level of experience, and risk appetite, and seek professional advice where needed.
Fusion Media would like to remind you that the data contained in this website is not necessarily real-time nor accurate. The data and prices on the website are not necessarily provided by any market or exchange, but may be provided by market makers, and so prices may not be accurate and may differ from the actual price at any given market, meaning prices are indicative and not appropriate for trading purposes. Fusion Media and any provider of the data contained in this website will not accept liability for any loss or damage as a result of your trading, or your reliance on the information contained within this website.
It is prohibited to use, store, reproduce, display, modify, transmit or distribute the data contained in this website without the explicit prior written permission of Fusion Media and/or the data provider. All intellectual property rights are reserved by the providers and/or the exchange providing the data contained in this website.
Fusion Media may be compensated by the advertisers that appear on the website, based on your interaction with the advertisements or advertisers.
© 2007-2024 - Fusion Media Limited. All Rights Reserved.