Fed cuts rates for third time, but Powell signals higher bar for further cuts
Last week, we officially launched our new cryptocurrency swing trading newsletter for Bitcoin technical analysis — CryptoPicks.
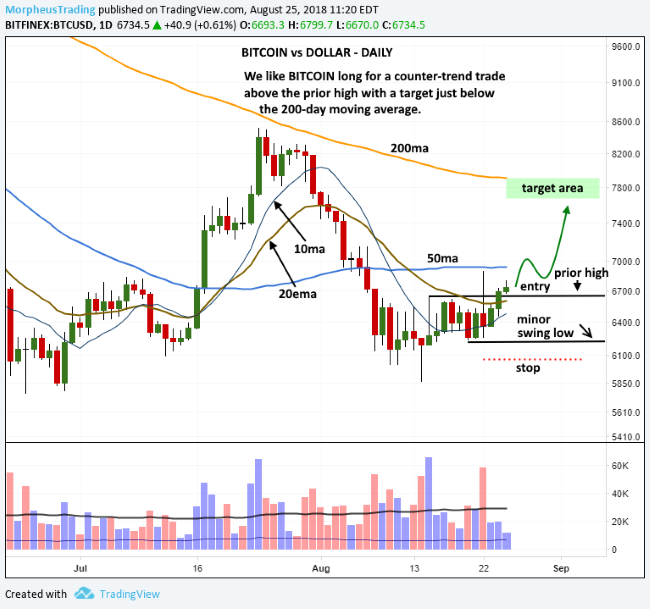
Bitcoin (Bitcoin (BitfinexUSD) was trading just above 6,700 at that time (Aug. 27).
It was also attempting to break out from a bullish consolidation pattern with higher lows.
Due to the bullish price action, we listed BTC/USD as a short-term crypto trade entry in that first issue of CryptoPicks.
We bought BTC/USD at market around the 6,800 level, while setting a protective stop at 6,049 (below support of the prior low).
The next day, Bitcoin followed through with a breakout above short-term resistance and past the 7,000 mark.
$BTC has been trending steadily higher off the August lows since then, and is currently showing a� +8.1%� gain since our Aug. 27 buy entry.
The chart below shows the original trade setup listed for� CryptoPicks subscribers at the time of buy entry:

BITCOIN vs. US DOLLAR weekly chart looking more bullish (BTC/USD)
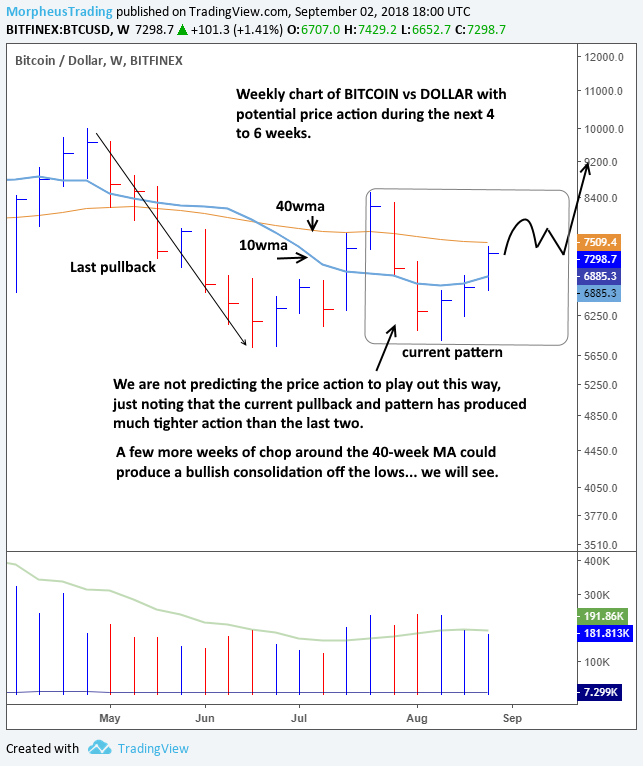
The weekly chart of BTC/USD (below) remains in chop mode, but the past five weeks of trading (the pullback and bounce up) look much different from the last two pullbacks.
The price tightened up considerably in August, with the 10-week moving average (teal line) starting to turn up.
If the 10-week moving average continues turning higher and crosses above the 40-week moving average (orange line), it will be an important bullish signal for Bitcoin traders.
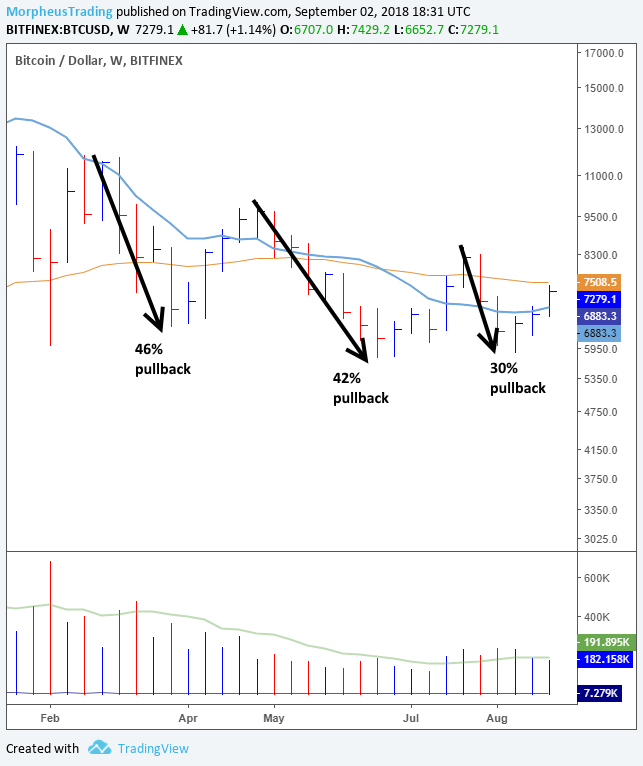
Notice on the chart below that each major pullback within this year’s consolidation has been less substantial:

Ideally, we’d like to see another week or two of higher prices, followed by 2-5 weeks of sideways consolidation that holds above the rising 10-week moving average.
If the price action plays out in this scenario, then we could see an intermediate-term buy signal emerge off the lows.
Check it out:

BTC/USD Trade Management
As detailed in the August 26 issue of� CryptoPicks, our price target listed at time of entry was 7,850 (+15% above buy entry).
More than halfway to our original price target in just a week, our Bitcoin ($BTC) swing trade is working well so far.
If Bitcoin hits our current price target of 7,850, we will automatically sell into strength to score a +15% gain on the cryptocurrency swing trade.
If we make any changes to our BTC/USD target price or stop price in the meantime, we’ll immediately send a trade alert to paid subscribers of CryptoPicks.
As always, remember to always honor your protective stops!
Technical Analysis of Bitcoin Cryptocurrency – September 2, 2018 (video)
Check out our latest CryptoPicks bitcoin video below for further technical analysis on the cryptocurrency charts above:
