
Talking Points
Foreign Exchange Price And Time At A Glance:
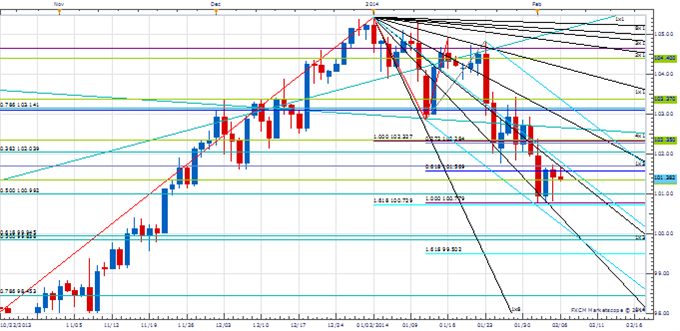 USD/JPY" title="USD/JPY" height="331" width="680">
Charts Created using Marketscope – Prepared by Kristian Kerr
- USD/JPY touched its lowest level in over two months on Tuesday before finding support at the 200% extension of the mid-January advance near 100.80
- Our near-term trend bias is lower in the exchange rate while below 102.40
- The 100.80 area is now a key near-term downside pivot with weakness below needed to force another important leg lower
- A cycle turn window is seen over the next few days in the index
- Only a close over the 3rd square root relationship of the year-to-date high at 102.35 would turn us positive on the exchange rate
USD/JPY Strategy: We like the short side while below 102.40, but position size should probably be reduced here.
Instrument | Support 2 | Support 1 | Spot | Resistance 1 | Resistance 2 |
*100.80 | 101.30 | 101.35 | 101.70 | *102.40 |
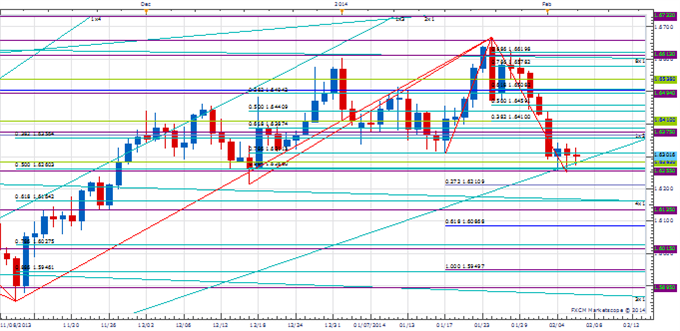 GBP/USD" title="GBP/USD" height="331" width="680">
Charts Created using Marketscope – Prepared by Kristian Kerr
- GBP/USD traded to its lowest level since mid-December on Wednesday before rebounding off the 12th square root relationship of the 2013 low at 1.6255
- Our near-term trend bias is now lower in Cable while below the 50% retracement of the year’s range at 1.6460
- A daily close below 1.6255 is really needed to signal a resumption of the immediate decline
- A minor cycle turn window is seen early next week
- Only a daily close over 1.6460 would shift the trend bias back to positive
GBP/USD Strategy: Like selling Cable, but only on strength.
Instrument | Support 2 | Support 1 | Spot | Resistance 1 | Resistance 2 |
1.6210 | *1.6255 | 1.6305 | 1.6380 | *1.6460 |
Focus Chart of the Day

The next few days look critical for the S&P 500. The index peaked out at the start of the two-week cyclical turn window we highlighted between the end of January and the start of this month. The short-term trend has most definitely turned with the SPX having come under steady pressure since about January 23rd. With this important turn window coming to a close at the end of the week we are now on the lookout for a potential low and there is some chance that yesterday’s reversal from 1737 may have been it. If the index is indeed recording an important bottom around this time then price should not exceed this week’s low (whatever it may be) next week on a daily close basis. Should the index continue to weaken into next week then it will confirm a more powerful change in trend and setup further weakness over the next few months.
--- Written by Kristian Kerr, Senior Currency Strategist for DailyFX.com