
Shares of Big Lots, Inc. (NYSE:BIG) have soared as much as 31.6% during the trading session on Dec 6. The stock received a boost following the company’s third-quarter fiscal 2019 results, with the top and the bottom line beat the Zacks Consensus Estimate for the third straight time. On the top-line front, the company witnessed its third consecutive quarter of year-over-year growth.
Further, management stated that it has commenced the fourth quarter on a solid note. Despite shorter holiday shopping period, sales were backed by Thanksgiving and Black Friday. Moreover, management expects positive comparable store sales (comps) in the fourth quarter of fiscal 2019, after seeing a dip in the third quarter.
Big Lots, Inc. Price, Consensus and EPS Surprise
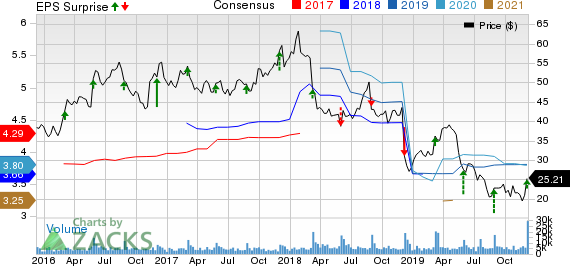
Big Lots, Inc. price-consensus-eps-surprise-chart | Big Lots, Inc. Quote
Q3 in Details
This Columbus, OH-based company posted adjusted net loss of 18 cents a share that was narrower the Zacks Consensus Estimate of a loss of 21 cents. The bottom line came within management’s guidance of a loss of 15-25 cents. However, the quarterly loss was wider than a loss of 16 cents reported in the prior-year quarter.
Net sales inched up 1.6% to $1,168 million and beat the Zacks Consensus Estimate of $1,161 million. The upside can be attributed to sales growth in high volume new stores and increased store count. Notably, furniture was the top performing category that registered a mid-single digit comps growth in the quarter.
Comps dropped 0.1% against the company’s expectations of flat comps for the fiscal third quarter. Although sales were sluggish in August, the company saw some sequential improvement in sales trends during September and October.
Gross profit increased 0.9% year over year to $463.4 million, while gross margin contracted 20 basis points (bps) to 39.7%. The downside was caused by higher markdown rate and promotional expenses that were partially offset by favorable merchandise mix. The company expects gross margin for the fiscal fourth quarter to be under pressure due to higher promotion expenses and adverse impact of tariffs.
In the reported quarter, adjusted S&A expenses came in at $433.2 million, up 5.3% year over year. However, the metric (as a percentage of net sales) remained unchanged in the same period last year.
Adjusted operating loss came in at $4.5 million against the prior-year quarter’s operating income of $2.8 million.
Other Financial Details
This Zacks Rank #3 (Hold) company ended the quarter with cash and cash equivalents of $62 million. Inventories increased 4% to $1,117 million. Long-term debt totaled $501 million, up from $488 million in the prior-year quarter. Total shareholders’ equity was $762.3 million.
Management stated that increases in inventory were caused due to planned year-over-year sales increases and inventory builds in certain merchandise categories, including Furniture and Soft Home. However, the company forecasts inventory at the end of fiscal fourth quarter to be down slightly year over year.
Year to date, the company has returned about $87 million to its shareholders in the form of share repurchases and dividend.
Guidance
Big Lots’ projects comps to be positive in the fourth quarter. Also, management expects sales growth similar to what was witnessed in the fiscal third quarter. Based on these expectations, the company envisions fourth-quarter earnings per share (EPS) in the range of $2.40-$2.55, which suggests a decline from $2.68 delivered in the year-ago quarter. The Zacks Consensus Estimate for the bottom line is pegged at $2.56 per share.
For fiscal 2019, the company continues to expect adjusted earnings in the range of $3.70-$3.85 per share. However, the guidance indicates a decline from the prior-year’s reported figure of $4.04. The Zacks Consensus Estimate for earnings in the fiscal year is pegged at $3.81.
Top picks
Target Corporation (NYSE:TGT) , with a Zacks Rank #1 (Strong Buy), has a long-term EPS growth rate of 7.6%. You can see the complete list of today’s Zacks #1 Rank stocks here.
The TJX Companies, Inc (NYSE:TJX) , with a Zacks Rank #2 (Buy), has a long-term EPS growth rate of 10.6%.
Dollar General Corporation (NYSE:DG) , with a Zacks Rank #2, has a long-term EPS growth rate of 11.2%.
The Hottest Tech Mega-Trend of All
Last year, it generated $24 billion in global revenues. By 2020, it's predicted to blast through the roof to $77.6 billion. Famed investor Mark Cuban says it will produce "the world's first trillionaires," but that should still leave plenty of money for regular investors who make the right trades early.
See Zacks' 3 Best Stocks to Play This Trend >>
Big Lots, Inc. (BIG): Free Stock Analysis Report
Dollar General Corporation (DG): Free Stock Analysis Report
The TJX Companies, Inc. (TJX): Free Stock Analysis Report
Target Corporation (TGT): Free Stock Analysis Report
Original post