
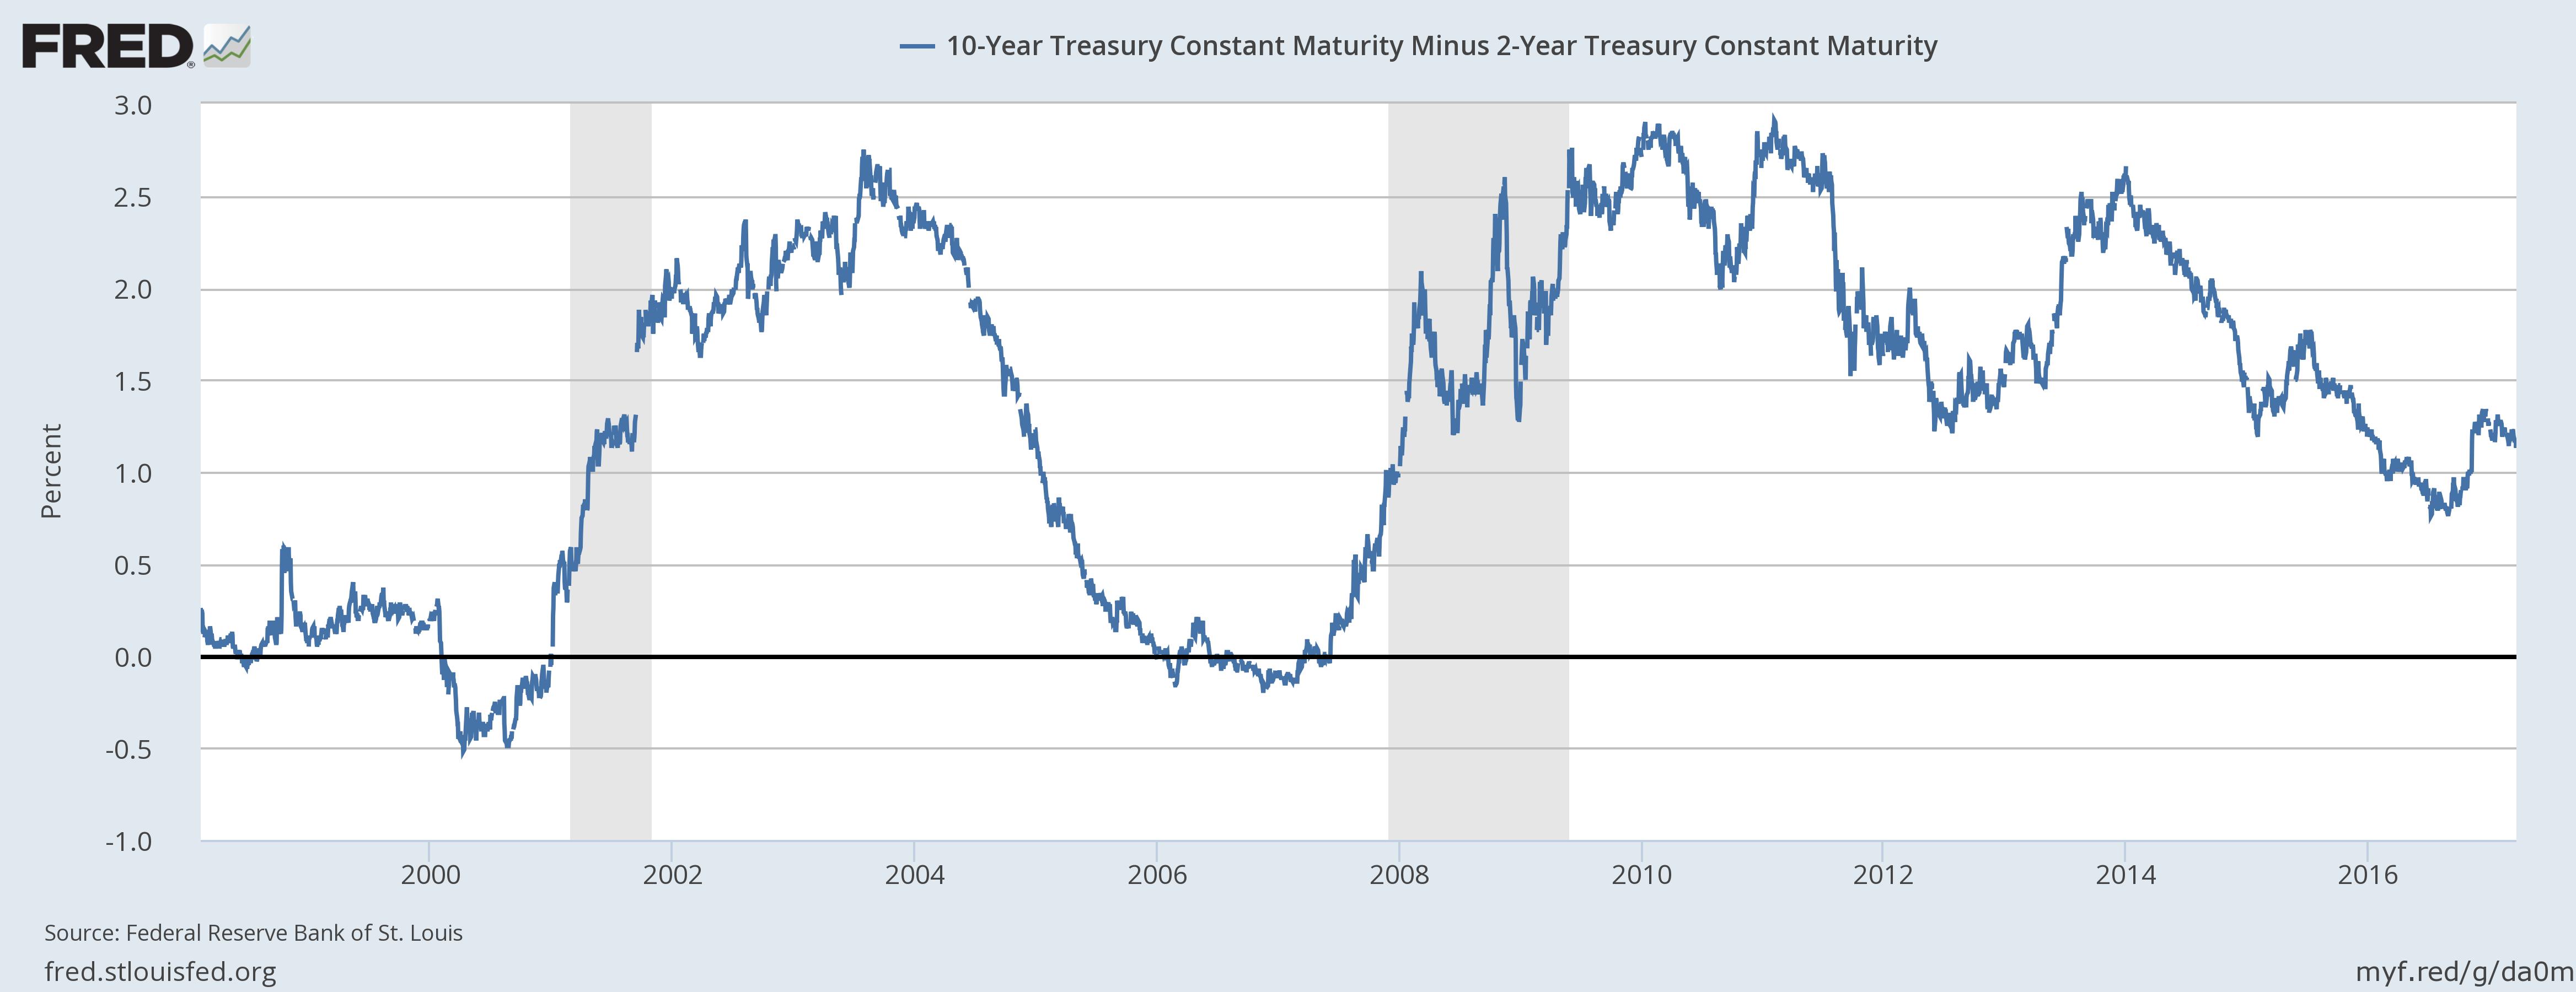
The Fed did, as expected, hike rates at their last meeting. And interestingly, interest rates have done nothing but fall since that day. As I predicted in the last BWER, Greenspan’s conundrum is making a comeback. The Fed can do whatever it wants with Fed funds – heck, barely anyone is using it anyway – but they can’t control what the market does with long term rates. At least not without making a commitment like the BOJ did with JGBs to cap the 10 year rate. Of course, the BOJ now owns 42% of the Japanese government bond market so there is that. But I digress; the point is that that the yield curve flattened since the last update, growth expectations falling.
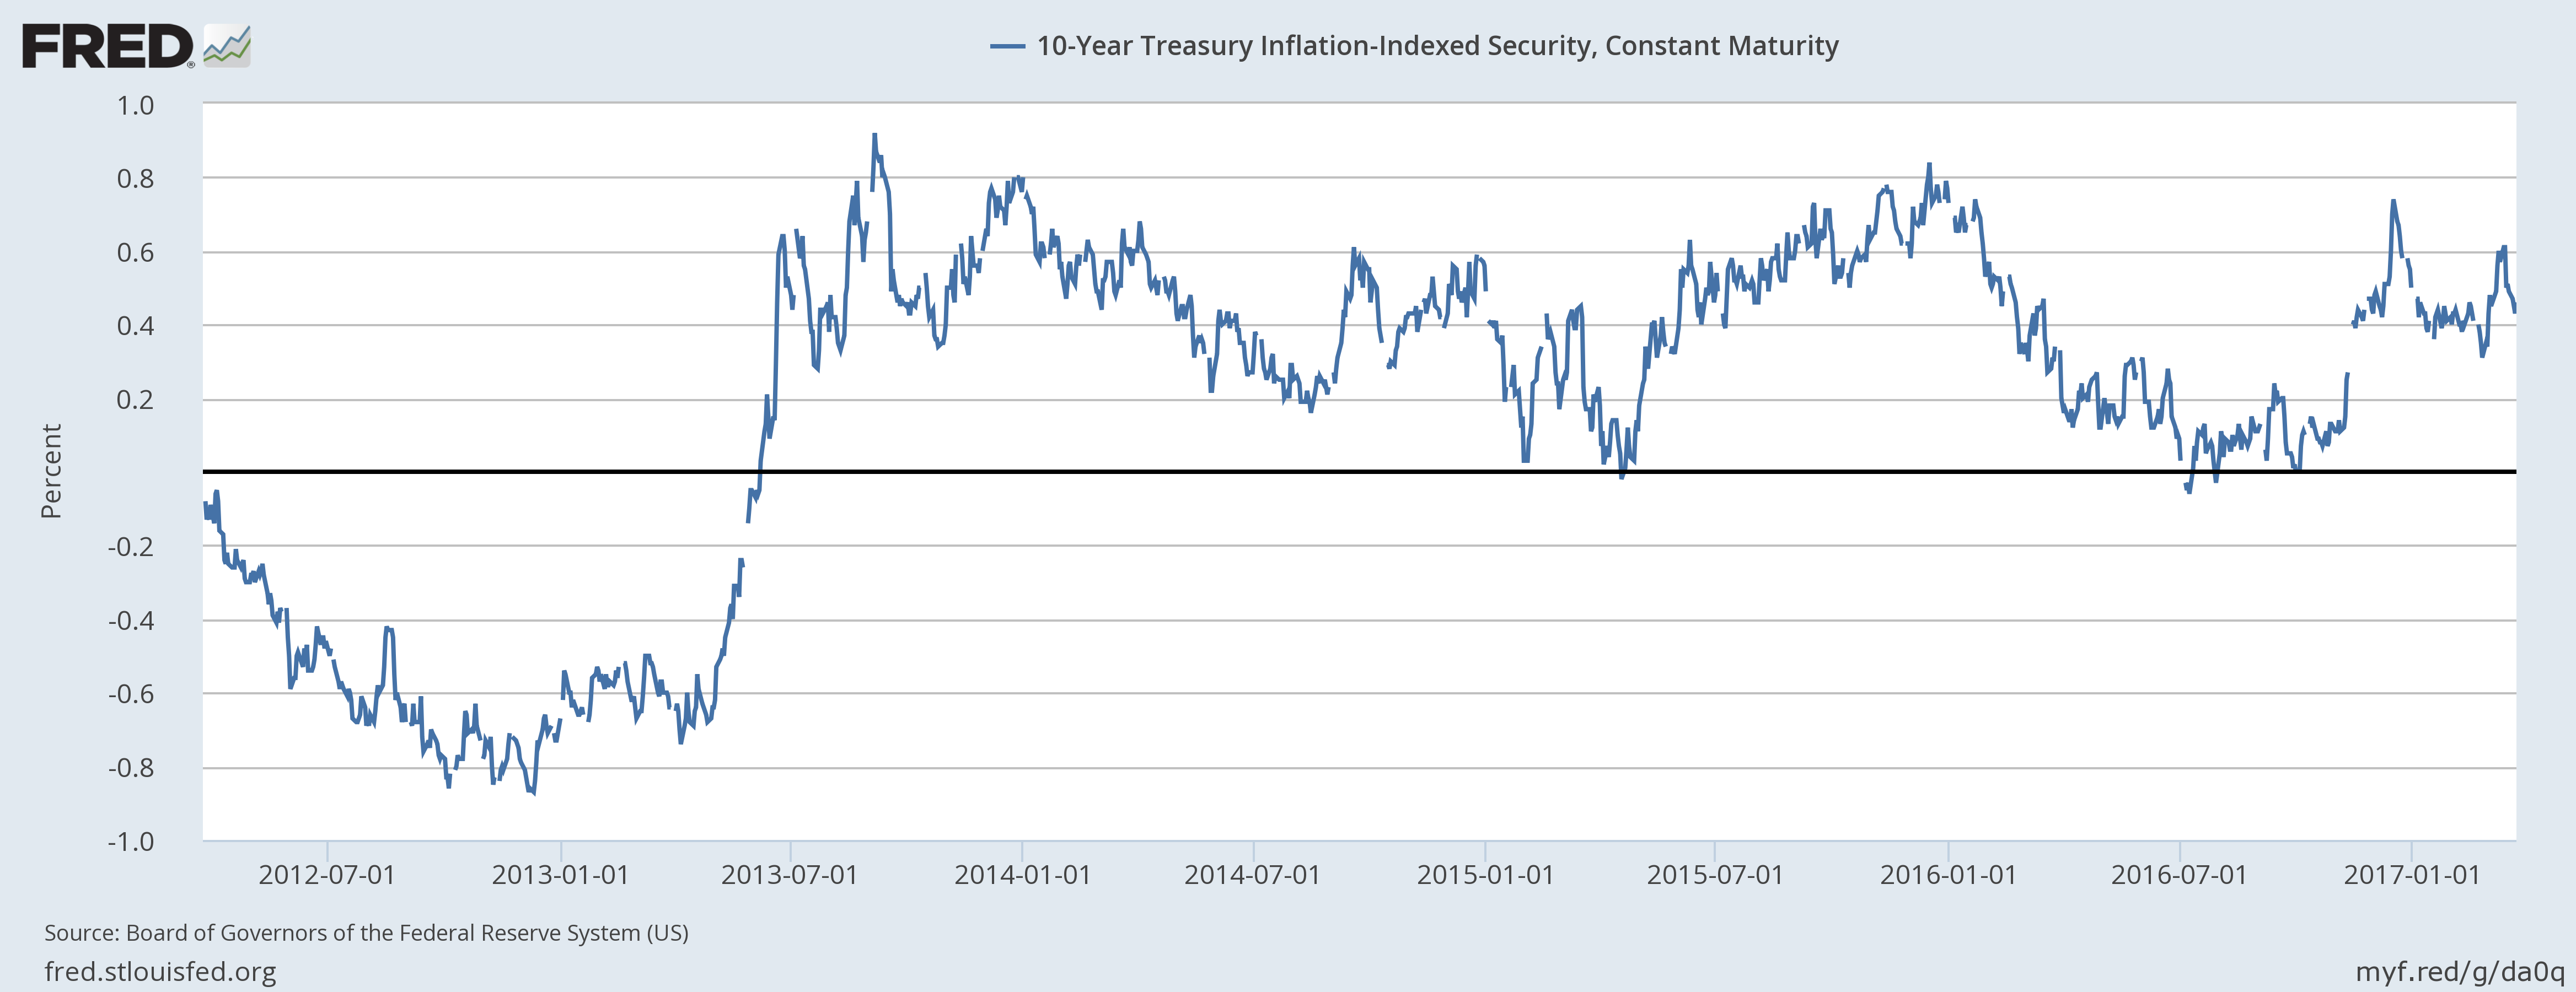
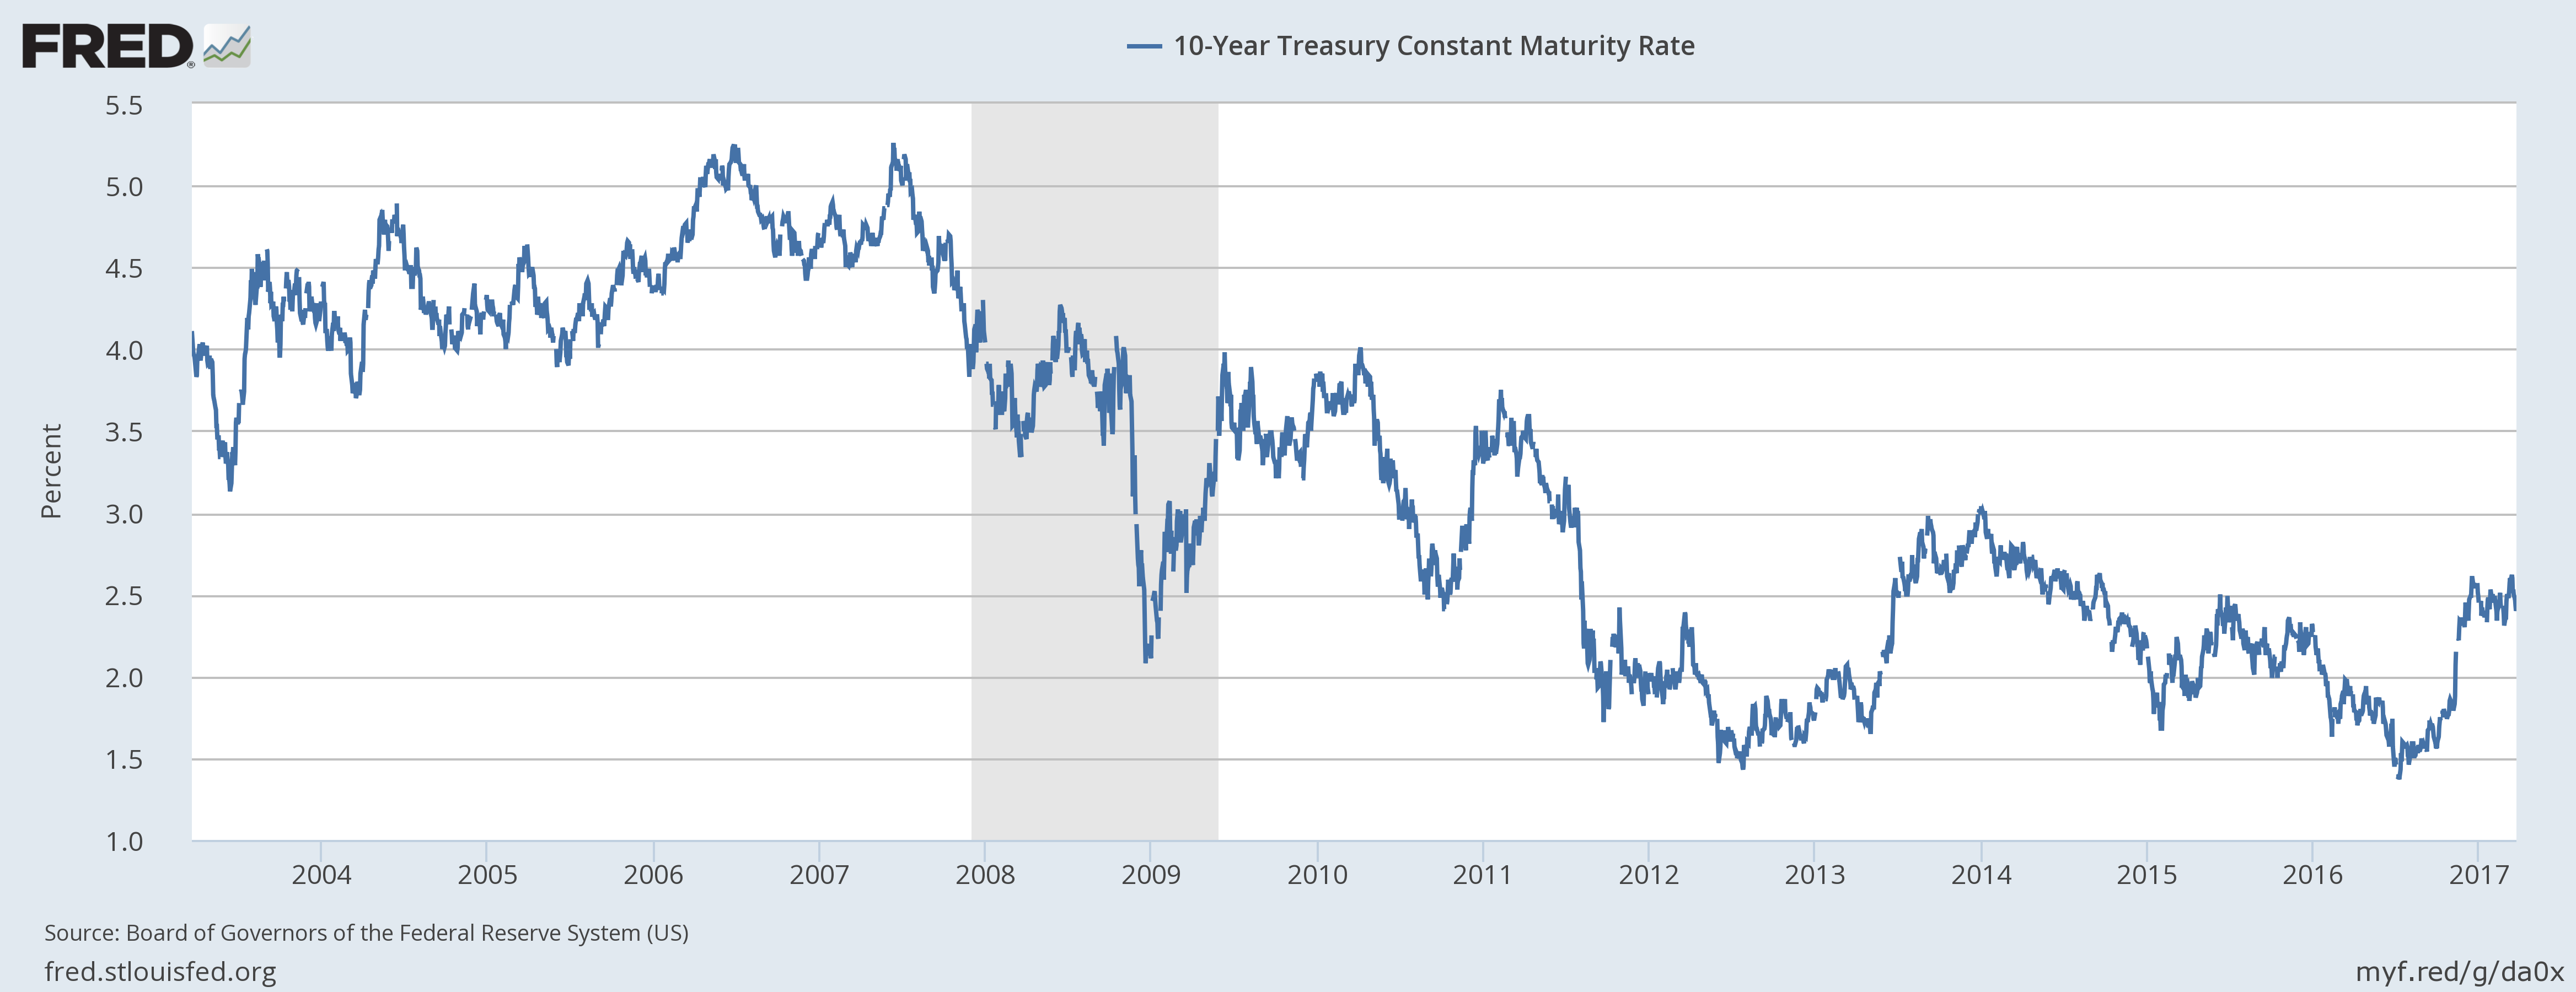
The rally in the long end of the curve has been attributed to a partial unwinding of the Trump trade and that is probably at least partially true. But the simpler, Occam’s Razor explanation, is that the market is reacting negatively to the rate hike. Higher rates in the context of slowing loan growth, peaking auto sales and a sluggish real estate recovery may not be the best idea for an economy struggling to grow at even the reduced pace of the last few years. And while growth and inflation expectations did rise after the election, the bond market was never on board with the administration’s dreams of a return to the 3.5 to 4% growth Americans expect. At the recent peak of 2.62% nominal and 0.75% real (TIPS), the 10 year note was already skeptical of the efficacy of the Trump agenda.
The economic data since the last update was a bit less optimistic than recently but discovering that required digging into the details. Housing starts, for instance, were reported up from the previous month and year over year. But permits were down on the month and peaked 2 years ago as multi-family construction appears to be stalling. And while it isn’t directly related, the FHFA housing price index was flat last month and the year over year rate of change has peaked. If demand for housing is that robust, why aren’t prices going up?
Further, new homes sales were also reported up and better than expected but the median price fell 3.9% on the month and 4.9% year over year. Average price by the way jumped 9.9% to an all time high of $390,400 but that is a function of the mix of houses sold. Like a lot of other sectors, the high end of the housing market is doing pretty well while the rest of it is not.
On the goods side of the economy, industrial production figures and durable goods orders painted the same mixed picture. IP was flat on the month but the manufacturing part was higher with strength in business equipment but the durables report showed capital goods orders falling. We continue to see positive sentiment at the business and consumer levels but it isn’t translating – yet – into actual activity. I suspect some of that is due to, ironically, expectations regarding potential economic policy changes.
For instance, we’ve seen a pretty big drop-off recently in the growth of C&I (business) loans. Could that be due to uncertainty regarding the deductibility of interest charges? That’s part of the Republican tax reform and a prudent company might want to wait and see if that passes before taking on new debt. More generally, the proposed tax reform also allows expensing of capital investments. What if tax reform is delayed and doesn’t apply to 2017 investments? Companies seem to be taking a wait and see approach.
Even the strongest and most consistent of economic statistics – employment – showed some cracks over the last two weeks. We had a pretty good employment report a few weeks ago but the Labor Market Conditions Index, reported two weeks ago today, is barely above zero. It isn’t indicating any big problems but it definitely downshifted in late 2015 and hasn’t recovered. Weekly jobless claims have been climbing recently although 258,000 is still a very low number if well off the recent lows. The JOLTS report did show a rise in job openings but the current level is basically the same as two years ago although the hiring rate was up some.
Still, the economy has performed better the last six months or so and that is reflected in our market indicators as well as the data. The CFNAI, a broad measure of economic activity, turned positive again and the three month average, at 0.25, is nowhere near a recession level. It isn’t anything to celebrate though; it shows growth only slightly – very slightly – above trend.
As I said above, the yield curve flattened slightly since the last update:
10 Year TIPS yields fell 11 basis points as real growth expectations moderated:
The nominal 10 year note yield fell more, 17 basis points:
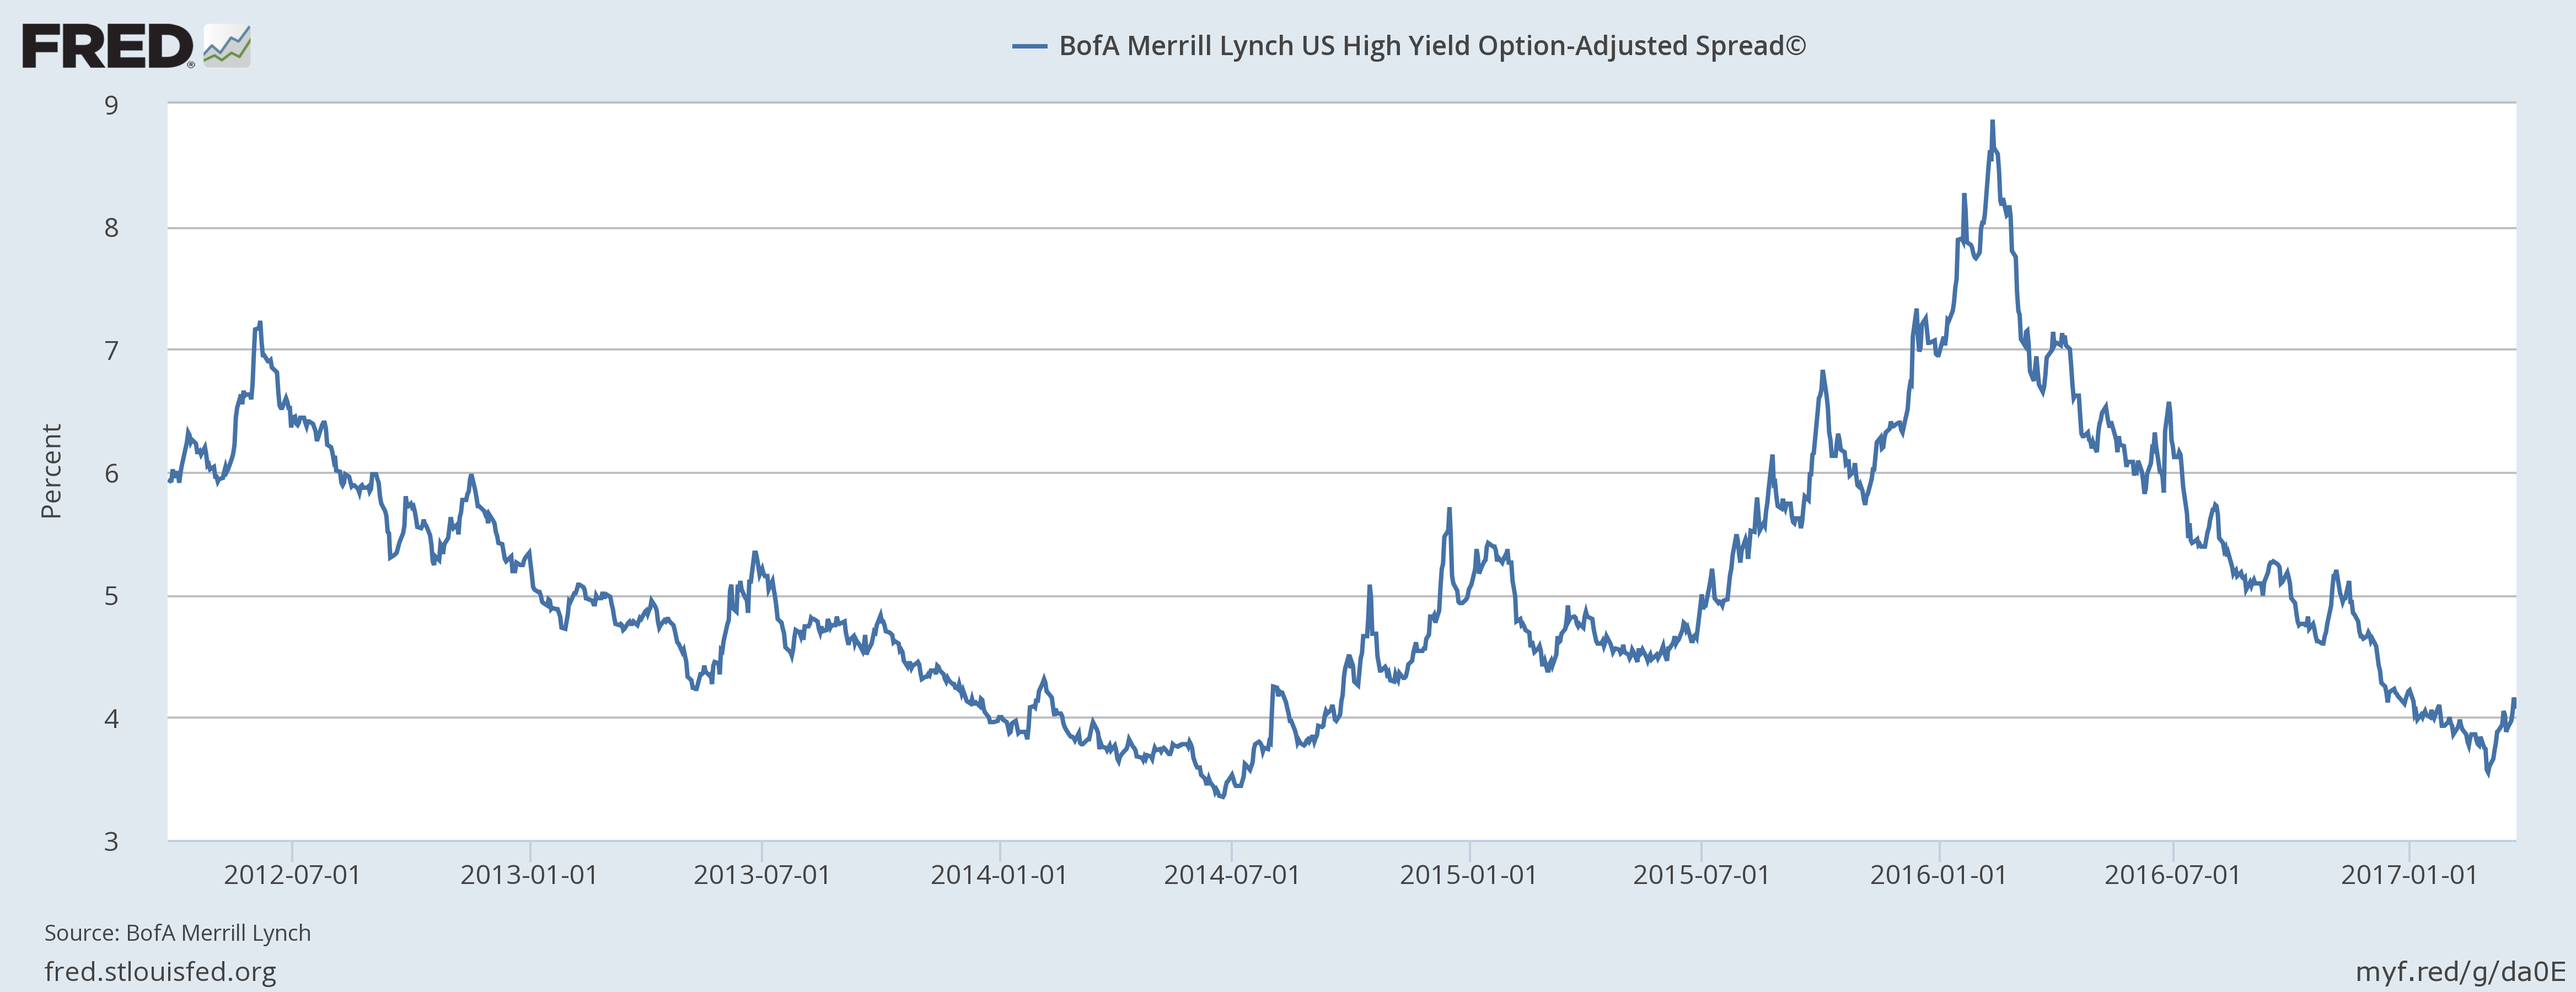
Of perhaps more concern are credit spreads which continued the move wider we reported in the last update. This doesn’t mean anything yet but if it continues could trigger a wider correction:
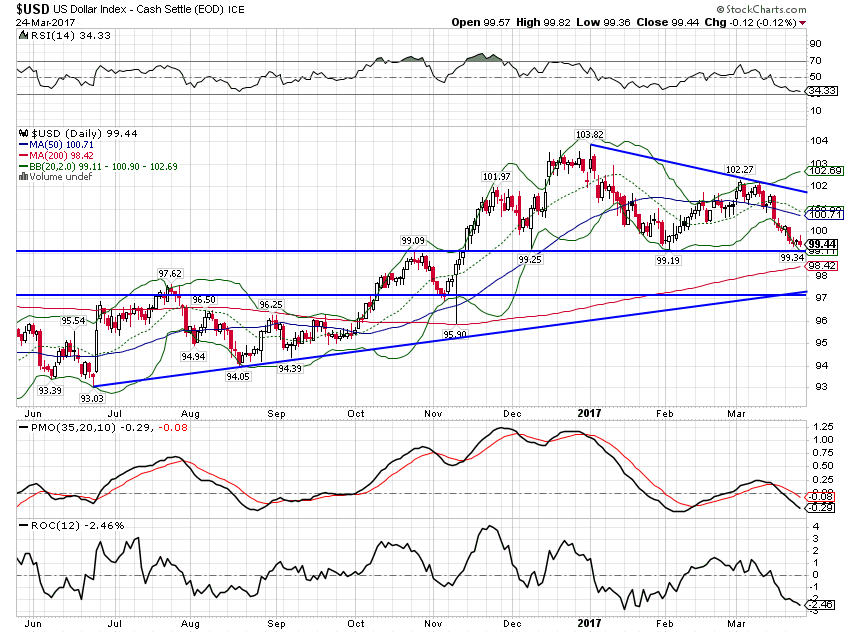
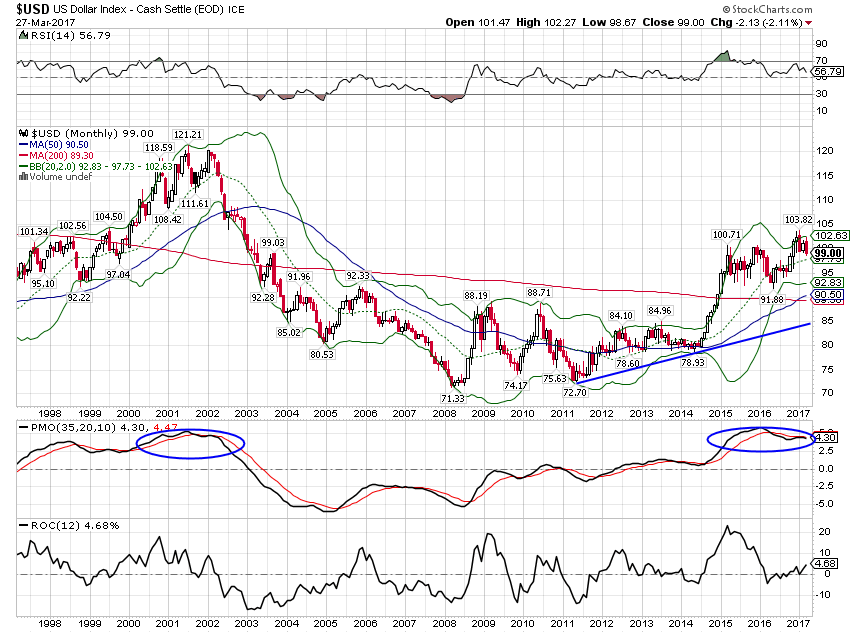
The topping process we’ve been observing in the US dollar index also continued. I’ve said since the election that I expect the administration, given all its unorthodox views on trade, to pursue a weak dollar policy. They’ve been doing it sotto voce so far but that could change if they aren’t able to get any traction on changes that require legislation to pass what is proving to be a recalcitrant Congress. Watch the 99 level as support:
The longer term topping process. We expect the index to eventually touch that rising trend line.
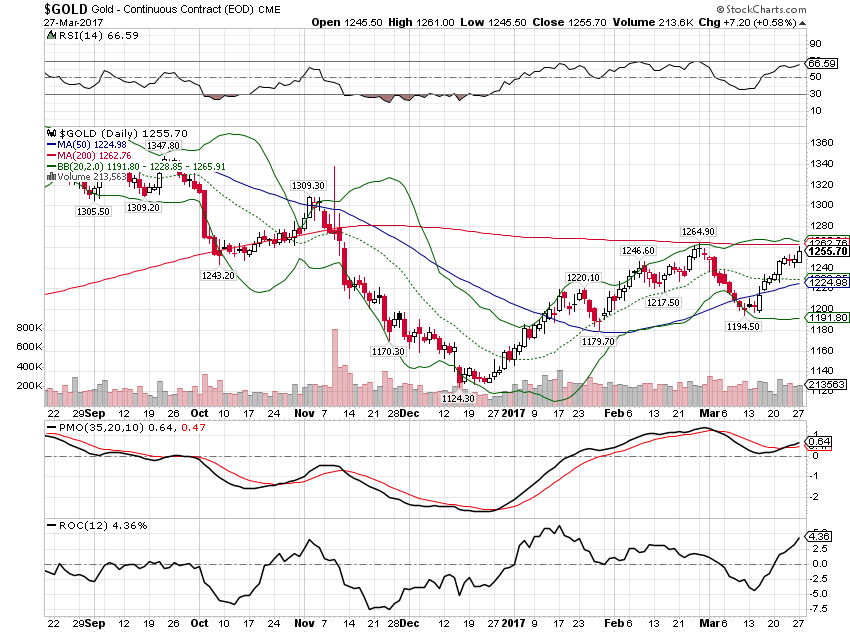
With the dollar weak, gold moved higher and is poised to take out the 200 day MA resistance on the second attempt. Just another confirmation that growth expectations have weakened:
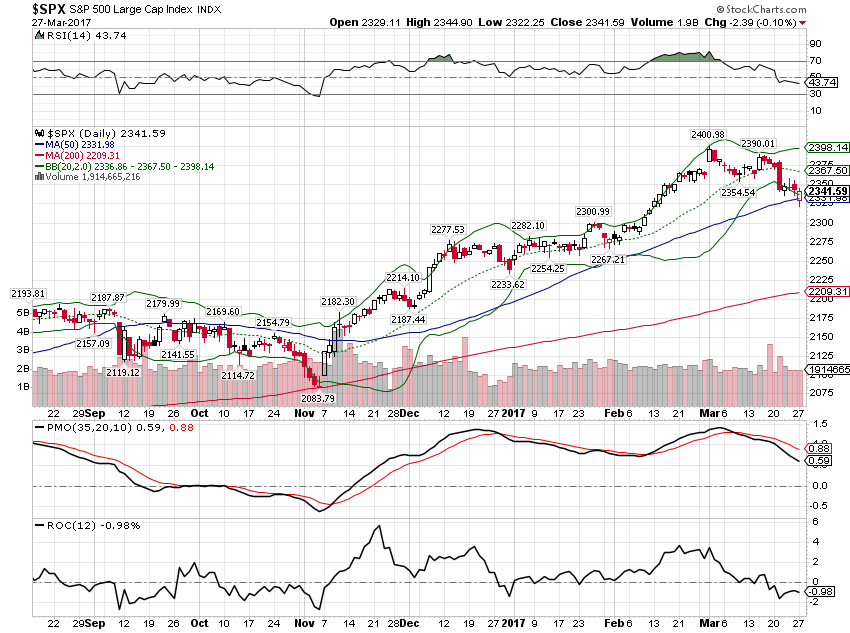
Stocks also reflected the change in growth expectations but the sell-off so far is a very mild, orderly 2.5%.
The incoming economic data and our market based indicators show the economy continuing along its former path of 1.5 to 2% growth. I have said – for years now – that we won’t get off that track until we change either workforce growth or productivity growth. The Trump administration would seem to be counting primarily on the latter but so far all they’ve been able to change is attitude, which is important but not sufficient. How and when economic policy is changed is of utmost importance to future growth.
The failure to get healthcare reform done hurts but it will pale in comparison if tax reform comes to a similar fate. Having built up expectations, a failure now would not just take us back to the ex-ante, pre-election status quo. Such a disappointment could well be the type of shock that knocks this fragile economy into recession.
