Get 40% Off
👀 👁 🧿 All eyes on Biogen, up +4,56% after posting earnings. Our AI picked it in March 2024.
Which stocks will surge next?
Unlock AI-picked Stocks

Berkshire’s Double Divergence Spells Trouble

Published 08/07/2017, 06:16 AM
Updated 07/09/2023, 06:31 AM

Berkshire Hathaway's (NYSE:BRKb) shareholders are not like the owners of other public companies. By following Warren Buffett’s long-term approach, most of them stay with the company in good times and bad, regardless of what the market is doing with the price of the stock. Nevertheless, it pays to be prepared.

The last time we wrote about Berkshire was on November 25th, 2016. Almost nine months ago, while the stock was trading slightly below $160 a share, Elliott Wave analysis suggested the bulls should be able to reach $170, only to complete the five-wave impulse pattern, which has been in progress since the low in 2009. According to the theory, every impulse is followed by a three-wave correction in the opposite direction.

BRK.B is already approaching the $180 mark, so obviously we underestimated the strength of the uptrend. But does this mean the overall outlook has changed and we should no longer expect a decline? The updated chart below might help us find out.
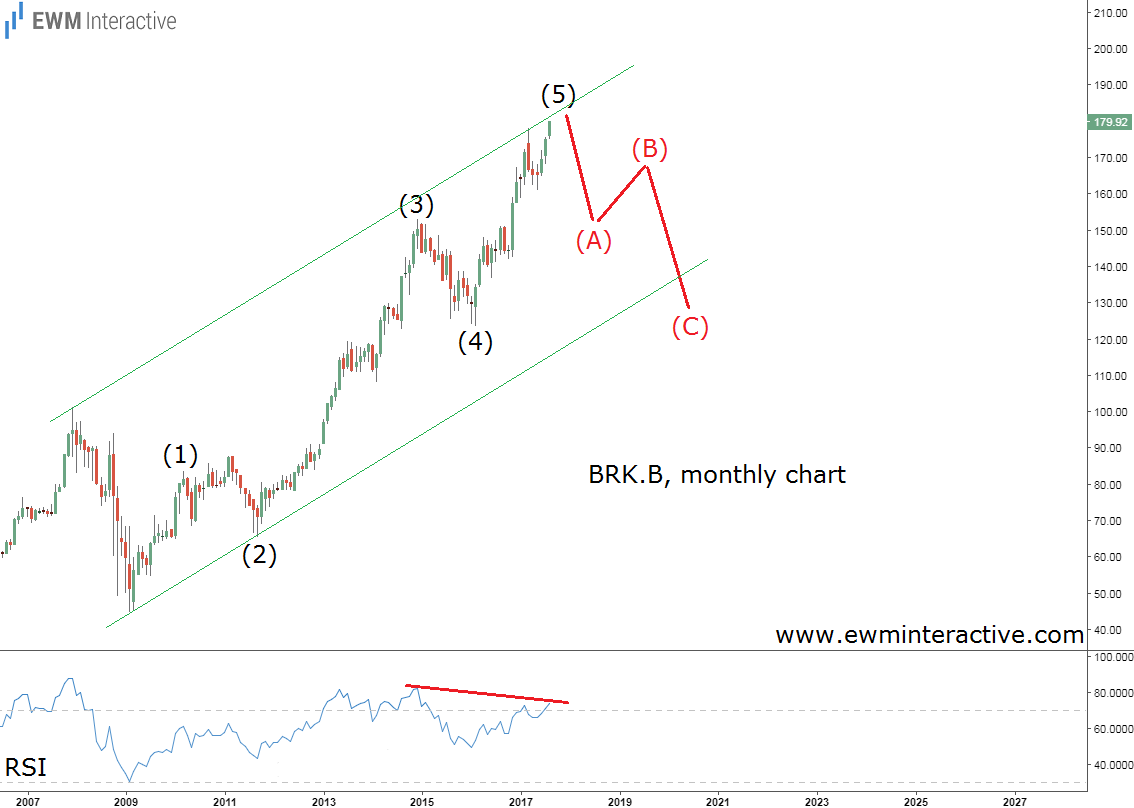
BRK.B Monthly Chart

The monthly chart of Berkshire stock shows that the entire advance since March 2009 still looks like a textbook impulse. Furthermore, the relative strength index shows the typical bearish divergence between waves (5) and (3), indicating the bulls are slowly but surely running out of power.

Usually, the negative phase of the cycle drags the price back to the support area of the fourth wave. Here, this means that once wave (5) ends, BRK.B stock should plunge to the zone between $130 and $120 a share. What is left of wave (5) then?
3rd party Ad. Not an offer or recommendation by Investing.com. See disclosure here or remove ads .

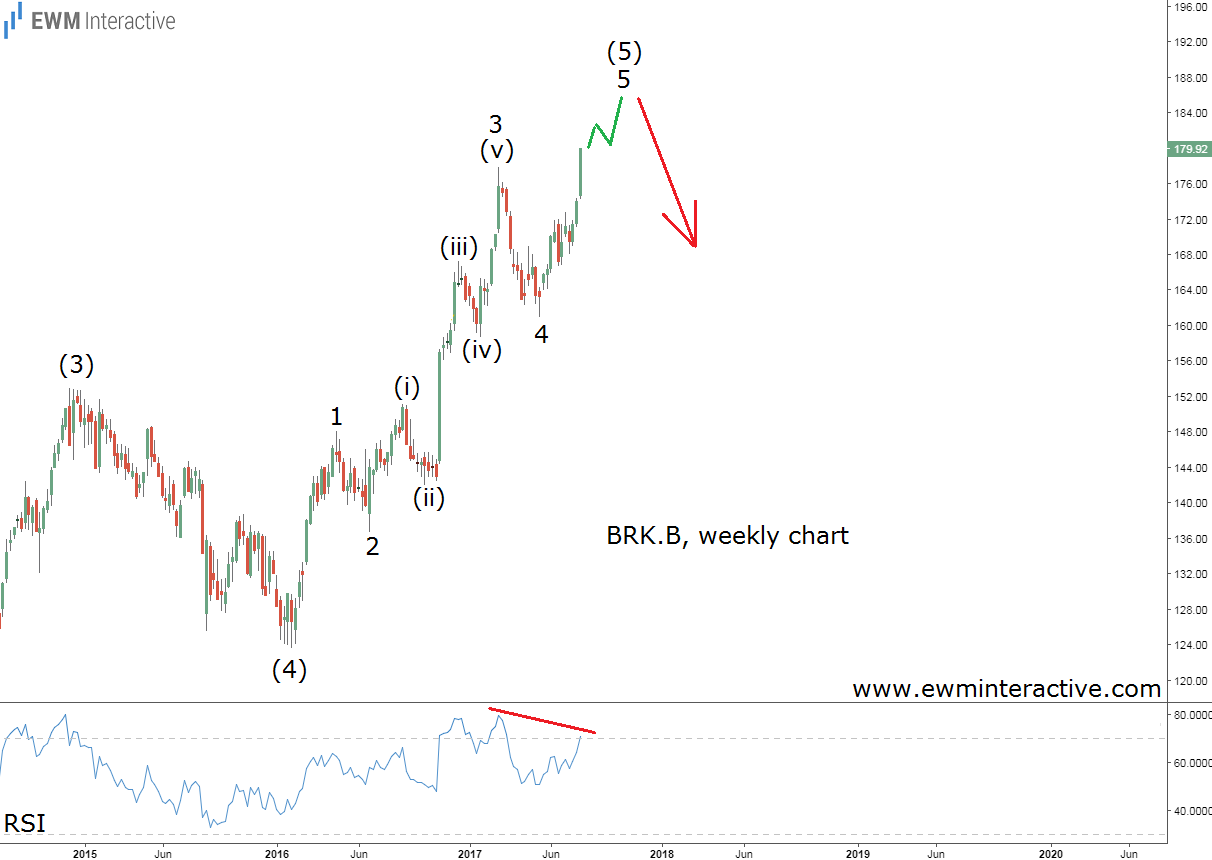
Berkshire Elliott Wave Analysis Monthly Chart

The weekly chart above allows us to take a look at the wave structure of wave (5). As you can see, it too looks like a complete five-wave pattern. The sub-waves of wave 3 of (5) are also clearly visible. And, just like on the previous chart, the RSI indicator shows a bearish divergence between the last two high in wave 5 and 3 of (5).

Even the best of companies, one of which Berkshire Hathaway (NYSE:BRKa) undoubtedly is, are not immuned to market declines, as the 2007-2009 period clearly demonstrated. Long-term shareholder should probably stay true to they philosophy and hold BRK.B no matter what, but for those, who are yet to join Mr. Buffett’s boat, $180 might turn out to be a very inappropriate level to buy in.

Original post

Latest comments

Risk Disclosure: Trading in financial instruments and/or cryptocurrencies involves high risks including the risk of losing some, or all, of your investment amount, and may not be suitable for all investors. Prices of cryptocurrencies are extremely volatile and may be affected by external factors such as financial, regulatory or political events. Trading on margin increases the financial risks.
Before deciding to trade in financial instrument or cryptocurrencies you should be fully informed of the risks and costs associated with trading the financial markets, carefully consider your investment objectives, level of experience, and risk appetite, and seek professional advice where needed.
Fusion Media would like to remind you that the data contained in this website is not necessarily real-time nor accurate. The data and prices on the website are not necessarily provided by any market or exchange, but may be provided by market makers, and so prices may not be accurate and may differ from the actual price at any given market, meaning prices are indicative and not appropriate for trading purposes. Fusion Media and any provider of the data contained in this website will not accept liability for any loss or damage as a result of your trading, or your reliance on the information contained within this website.
It is prohibited to use, store, reproduce, display, modify, transmit or distribute the data contained in this website without the explicit prior written permission of Fusion Media and/or the data provider. All intellectual property rights are reserved by the providers and/or the exchange providing the data contained in this website.
Fusion Media may be compensated by the advertisers that appear on the website, based on your interaction with the advertisements or advertisers.
© 2007-2024 - Fusion Media Limited. All Rights Reserved.