Get 40% Off
🤯 Perficient is up a mind-blowing 53%. Our ProPicks AI saw the buying opportunity in March.Read full update

Bearish Perspective On Gold? That Depends On Your Timeframe

Published 12/10/2019, 02:18 AM
Updated 07/09/2023, 06:31 AM
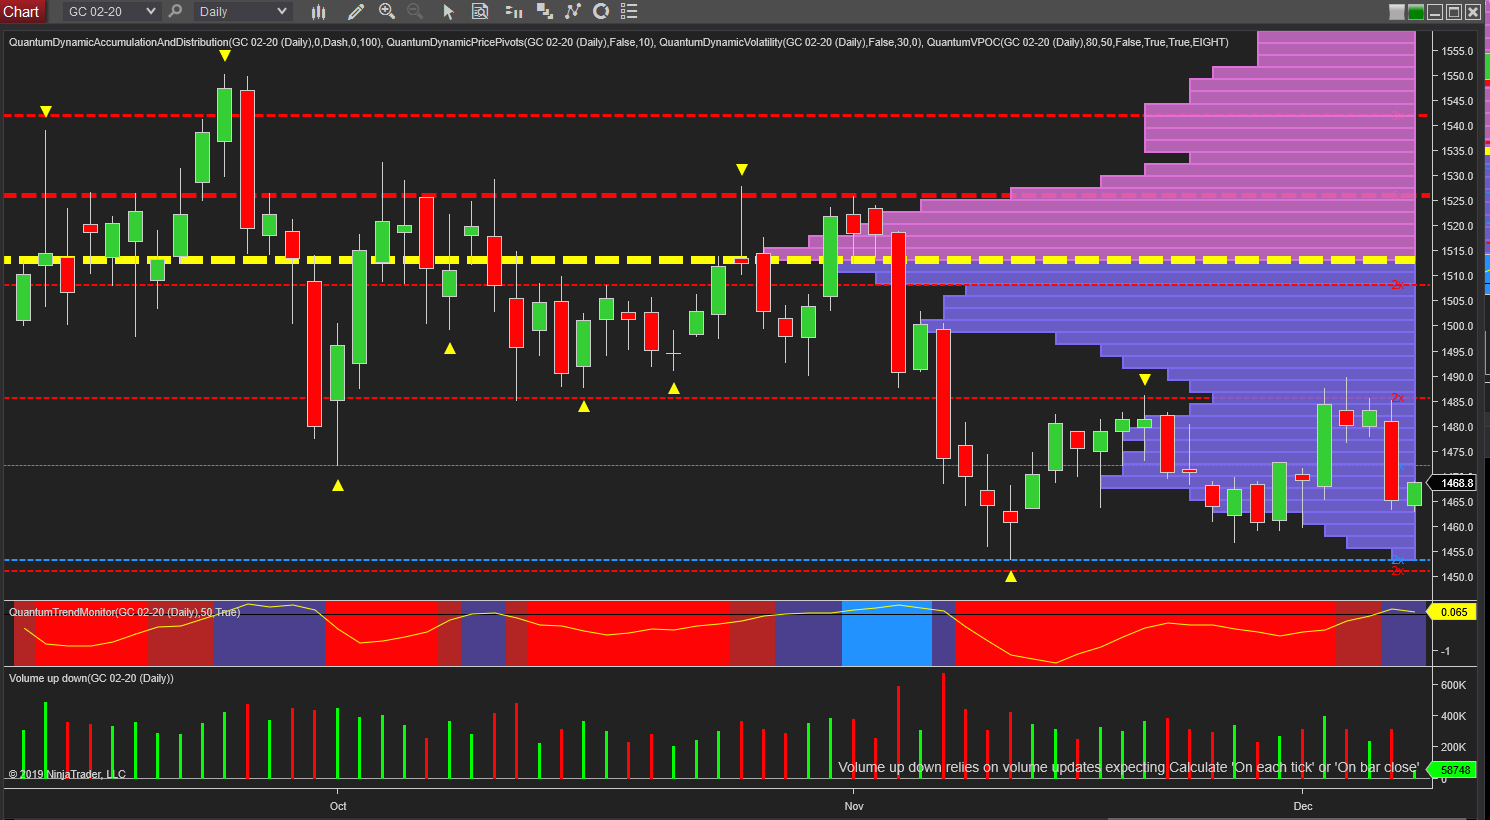
Gold Daily Chart

Your view on gold last week would depend on your perspective. As a gold bug or investor, it was a bad pespective, something that doesn't bode well for the medium-term. But as an intraday gold trader, it was an excellent vantage point, one that was an inverse of the price action for U.S. indices. Whilst they fell and the rose, signalling bullish momentum, gold rose then fell, closing the week back near the open.

This was denoted on the daily chart by a wide spread up candle on Tuesday, followed by a wide spread down candle on Friday. That occurred on good volume, confirming the fragile nature of the technical picture for gold with the move lower largely driven by a flow out of safe havens following the Nonfarm Payrolls data.

The issue now is where and when gold is likely to find some solid technical support. At present, on the daily chart, this appears to be waiting in the $1452 per ounce region. Here we have a cluster of two levels denoted with the blue and red dashed lines. Whilst individually not strong, as a cluster their strength increases.

These levels are delivered automatically by the accumulation and distribution indicator – the thicker the line the greater the strength of each level. In addition, and to add further to the bearish picture, the volume point of control is adding more downward pressure from the $1512 per ounce area. And with light volume now below on the VPOC histogram to the right of the chart, gold is likely to move through here relatively unopposed.
3rd party Ad. Not an offer or recommendation by Investing.com. See disclosure here or remove ads .
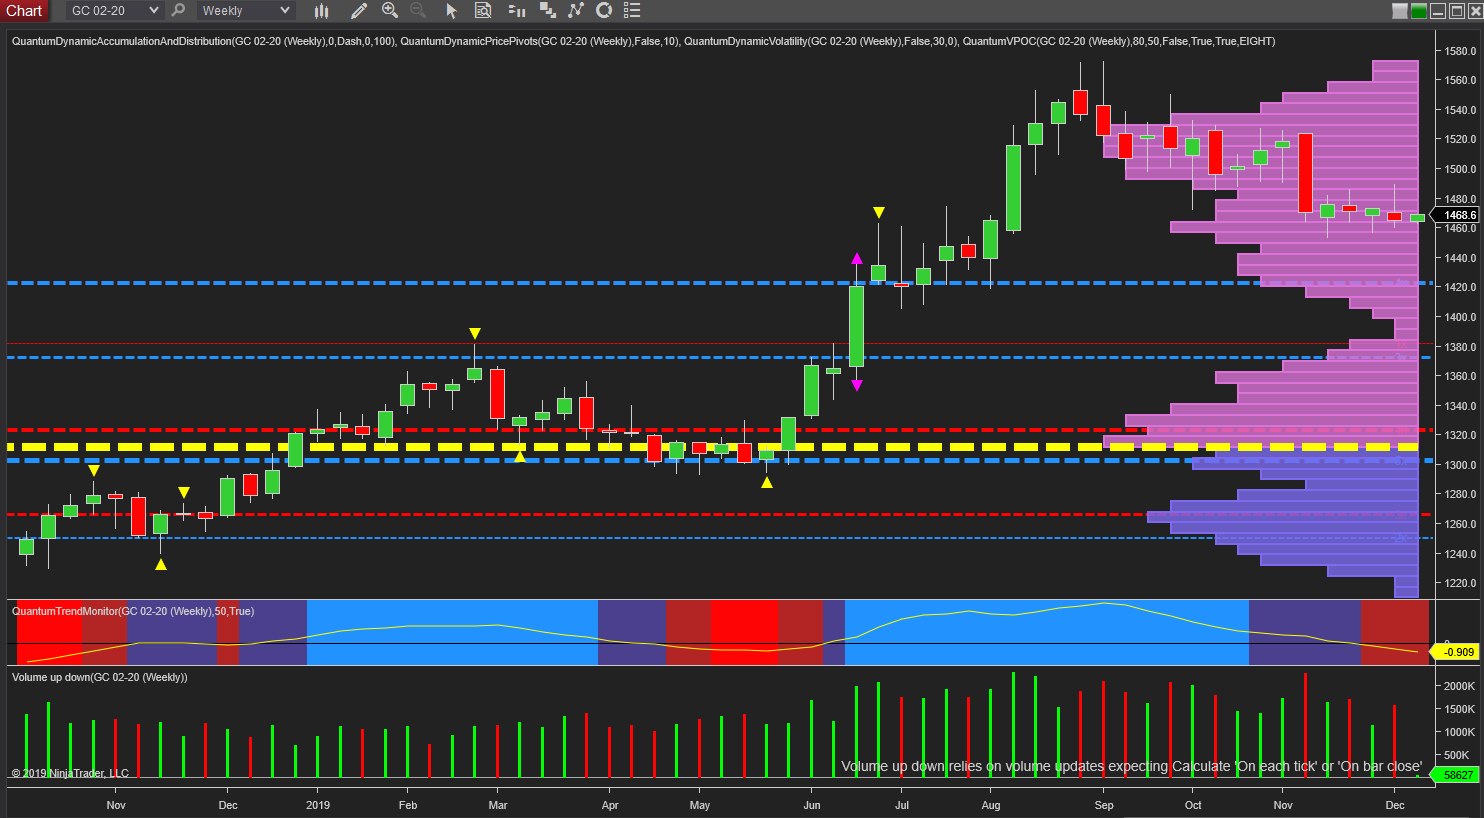
Gold Weekly Chart

Moving to the weekly chart, this perhaps makes the point more clearly, with last week’s price action and the associated volume portraying this weakness. On this timeframe, the next significant level of strong support is well below, in the $1420 per ounce area and denoted with the blue dashed line. This is followed by a low volume node on the VPOC histogram down to $1400 per ounce and below. Not an encouraging sign for gold bugs and investors, and confirmed with the trend monitor indicator which is now in transition from bullish to bearish, with the yellow trend line also falling. Any change to bright red on this time horizon will be bad news indeed.

Latest comments

Risk Disclosure: Trading in financial instruments and/or cryptocurrencies involves high risks including the risk of losing some, or all, of your investment amount, and may not be suitable for all investors. Prices of cryptocurrencies are extremely volatile and may be affected by external factors such as financial, regulatory or political events. Trading on margin increases the financial risks.
Before deciding to trade in financial instrument or cryptocurrencies you should be fully informed of the risks and costs associated with trading the financial markets, carefully consider your investment objectives, level of experience, and risk appetite, and seek professional advice where needed.
Fusion Media would like to remind you that the data contained in this website is not necessarily real-time nor accurate. The data and prices on the website are not necessarily provided by any market or exchange, but may be provided by market makers, and so prices may not be accurate and may differ from the actual price at any given market, meaning prices are indicative and not appropriate for trading purposes. Fusion Media and any provider of the data contained in this website will not accept liability for any loss or damage as a result of your trading, or your reliance on the information contained within this website.
It is prohibited to use, store, reproduce, display, modify, transmit or distribute the data contained in this website without the explicit prior written permission of Fusion Media and/or the data provider. All intellectual property rights are reserved by the providers and/or the exchange providing the data contained in this website.
Fusion Media may be compensated by the advertisers that appear on the website, based on your interaction with the advertisements or advertisers.
© 2007-2024 - Fusion Media Limited. All Rights Reserved.