
BB&T Corporation’s (NYSE:BBT) second-quarter 2017 adjusted earnings of 78 cents per share surpassed the Zacks Consensus Estimate by a penny.
Better-than-expected results were driven by an increase in revenues and lower expenses. The quarter also witnessed an increase in loans and leases. Moreover, profitability improved in the quarter. However, provision for credit losses increased, which was a headwind.
Results excluded merger-related and restructuring charges. After considering these, net income available to common shareholders was $631 million or 77 cents per share compared with $541 million or 66 cents per share in the prior-year quarter.
Revenues up, Costs Down
Total revenue (taxable-equivalent) for the quarter came in at $2.90 billion, up 3.9% year over year.
Tax-equivalent net interest income rose 1.1% from the prior-year quarter to $1.68 billion. Also, net interest margin increased 6 basis points (bps) from the prior-year quarter to 3.47%.
Non-interest income increased nearly 8% year over year to $1.22 billion. Rise in almost all fee income components, except mortgage banking income, led to the growth. Also, the quarter witnessed nil net FDIC loss share income.
Non-interest expense of $1.74 billion decreased 3.1% from the year-ago quarter. The decrease was primarily due to a fall in amortization of intangibles, net merger-related and restructuring charges and outside IT services related costs.
BB&T’s adjusted efficiency ratio came in at 58.6%, down from 59.6% in the prior-year quarter. A fall in efficiency ratio indicates a rise in profitability.
As of Jun 30, 2017, total deposits were nearly $157 billion, down from $161.3 billion in the prior-quarter. However, total loans and leases were $145.1 billion, up 0.8% sequentially.
Credit Quality: A Mixed Bag
As of Jun 30, 2017, total non-performing assets (NPAs) were $690 million, down 22.1% year over year. As a percentage of total assets, NPAs came in at 0.31%, down 9 bps year over year. Also, during the quarter, allowance for loan and lease losses came in at 1.03% of total loans and leases held for investment, down 3 bps year over year.
However, net charge-offs were 0.37% of average loans and leases, up 9 bps year over year. Further, provision for credit losses was $135 million at the end of the quarter, reflecting an increase of 21.6% year over year.
Profitability & Capital Ratios Improved
At the end of the reported quarter, return on average assets was 1.22%, up from 1.06% in the prior-year quarter. Return on average common equity increased to 9.30% from 8.21% as of Jun 30, 2016.
As of Jun 30, 2017, Tier 1 risk-based capital ratio was 12.1%, compared with 11.7% in the year-ago quarter. BB&T's estimated common equity Tier 1 ratio under Basel III (on a fully phased-in basis) was approximately 10.2% as of Jun 30, 2017.
Share Repurchases
During the reported quarter, BB&T repurchased $160 million worth shares through open-market purchases.
Our Take
We believe BB&T to remain well positioned for revenue growth through strategic acquisitions. These efforts will also support bottom-line growth in the near term. Moreover, consistent growth in loans along with improving rate scenario should propel its organic growth trajectory.
However, such acquisitions are expected to keep costs toward the higher end, which might hurt profitability. Also, the company’s exposure to risky loans continues to be a near-term concern.
BB&T Corporation Price, Consensus and EPS Surprise
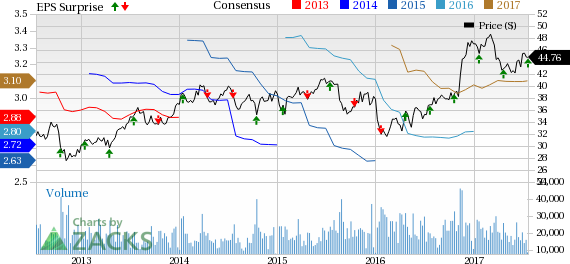
BB&T Corporation Price, Consensus and EPS Surprise | BB&T Corporation Quote
Currently, BB&T carries a Zacks Rank #3 (Hold). You can see the complete list of today’s Zacks #1 Rank (Strong Buy) stocks here.
Performance of Other Major Regional Banks
Comerica Inc.’s (NYSE:CMA) second-quarter 2017 adjusted earnings per share of $1.15 surpassed the Zacks Consensus Estimate of $1.07. Better-than-expected results reflect higher revenues and lower expenses. Moreover, lower provisions and better credit quality were the tailwinds.
Riding on higher revenues, The PNC Financial Services Group, Inc. (NYSE:PNC) reported a positive earnings surprise of 4.5% in second-quarter 2017. Earnings per share of $2.10 easily beat the Zacks Consensus Estimate of $2.01. Continued growth in loans helped the company earn higher revenues during the quarter, which were partially offset by an increase in expenses.
Among other Wall Street giants, SunTrust Banks, Inc. (NYSE:STI) is scheduled to report second-quarter 2017 earnings on Jul 21.
3 Top Picks to Ride the Hottest Tech Trend
Zacks just released a Special Report to guide you through a space that has already begun to transform our entire economy...
Last year, it was generating $8 billion in global revenues. By 2020, it's predicted to blast through the roof to $47 billion. Famed investor Mark Cuban says it will produce "the world's first trillionaires," but that should still leave plenty of money for those who make the right trades early. Download Report with 3 Top Tech Stocks >>
BB&T Corporation (BBT): Free Stock Analysis Report
PNC Financial Services Group, Inc. (The) (PNC): Free Stock Analysis Report
Comerica Incorporated (CMA): Free Stock Analysis Report
SunTrust Banks, Inc. (STI): Free Stock Analysis Report
Original post
Zacks Investment Research