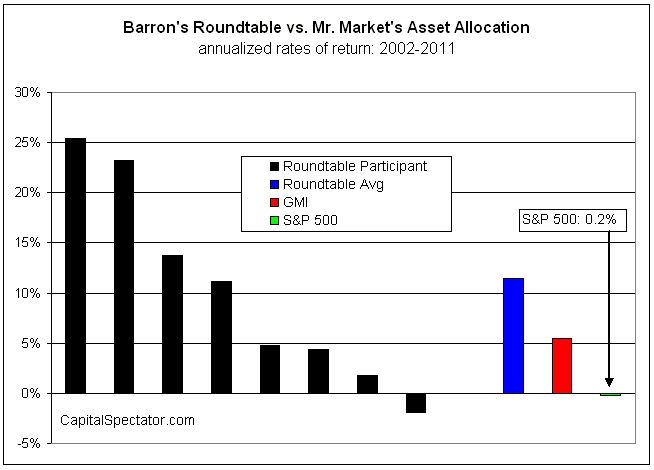
Mebane Faber has some fun thinking about an idea for an ETF that tracks the investment results published by the Barron's Roundtable, an annual feature dispenses an array of portfolio recommendations. As Pundit Tracker notes, following the investment picks of the annual Barron’s Roundtable has been a lucrative approach over the years. Since 2002, the average Roundtable return has been 11.5% versus -0.2% for S&P 500, with all but one of the members outperforming the index.
A Passive And Investable Benchmark
Of course, much depends on one's definition of "index." The standard answer is the S&P 500, but that's really just one piece of the world's capital and commodity markets. In any case, the roundtable numbers republished by Pundit Tracker inspired some thinking of my own. How, for example, did the Barron's Roundtable data compare with my proprietary Global Market Index, a passive and investable benchmark of all the major asset classes? And what does the comparison tell us about asset allocation vs. favoring star investment managers?
Pundit Tracker (PT) has the numbers on the roundtable and I have GMI data, so it's easy to compare the results. The S&P 500 is also included, via PT, although it's a bit hard to see in the lower right-hand corner in the chart below because this index's results for the 10-year span under scrutiny (2002-2011) is nearly flat at -0.2%. (Here are the numbers for the roundtable participants in the chart.)
The main message that pops out from the above chart is that a passive allocation across the major asset classes (red bar) is just about dead center relative to the performance numbers for the eight roundtable participants (based on the average of returns, as shown in the blue bar). Granted, this isn't a robust analysis, and for a number of reasons, starting with the small sample of returns from the participants. On the other hand, GMI's average performance vs. a pool of active managers is a familiar result in my statistical travels over the years.
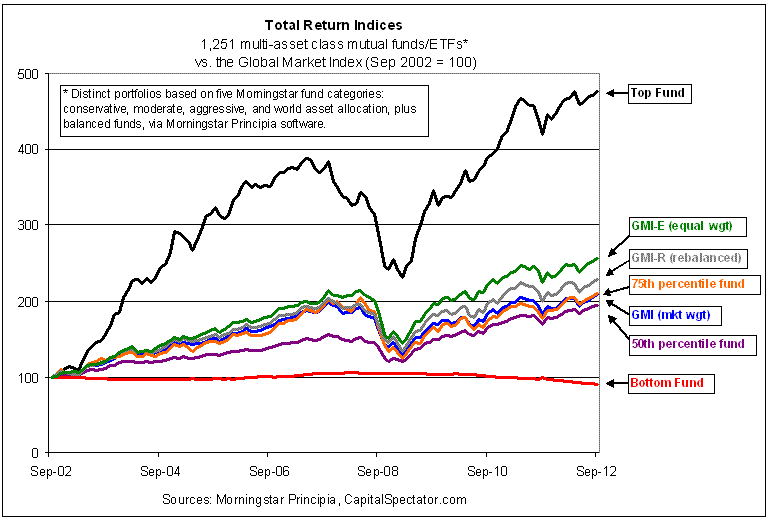
For instance, last October I compared GMI's 10-year performance to 1,200-plus actively managed asset allocation mutual funds with at least at decade of history. Once again, GMI ends up looking pretty good vs. the competition. Here's the chart I published last fall:
The Takehome
The lesson is that diversifying across all the major asset classes is a tough act to beat. Rebalancing the mix regularly tends to juice performance a bit higher. Filling the asset class buckets with low-cost ETFs and/or index mutual funds is usually an advantage too.
I'm not saying that trying to pick winners and losers in advance among active managers is a waste of time. But the challenges of trying to figure out which managers will do well, and which ones will stumble, are well known and widely documented. It's fair to say that excelling in this field requires a high degree of talent in its own right -- a talent that's relatively rare in terms of publicly available and verifiable track records.
By contrast, building a portfolio with a foundation that holds the major asset classes is easy and it tends to deliver average to above-average results vs. a wide array of strategies that claim to be superior. Why? A complete answer could fill a book, which is why I wrote, Dynamic Asset Allocation: Modern Portfolio Theory Updated for the Smart Investor. But there's also a short answer, and an intuitive one. As Bill Sharpe pointed out a number of years ago, the winning portfolios are financed by the losers. It's a zero sum game when it comes to investment returns. That's not the last word on designing investment strategies, but it's an empirical fact that should inspire some humility about what's probable, what's not, and what it suggests for designing and managing portfolios.
- English (UK)
- English (India)
- English (Canada)
- English (Australia)
- English (South Africa)
- English (Philippines)
- English (Nigeria)
- Deutsch
- Español (España)
- Español (México)
- Français
- Italiano
- Nederlands
- Português (Portugal)
- Polski
- Português (Brasil)
- Русский
- Türkçe
- العربية
- Ελληνικά
- Svenska
- Suomi
- עברית
- 日本語
- 한국어
- 简体中文
- 繁體中文
- Bahasa Indonesia
- Bahasa Melayu
- ไทย
- Tiếng Việt
- हिंदी
Barron's Roundtable vs. Mr. Market's Asset Allocation
Published 12/18/2012, 07:07 AM
Updated 07/09/2023, 06:31 AM
Barron's Roundtable vs. Mr. Market's Asset Allocation
3rd party Ad. Not an offer or recommendation by Investing.com. See disclosure here or
remove ads
.
Latest comments
Install Our App
Risk Disclosure: Trading in financial instruments and/or cryptocurrencies involves high risks including the risk of losing some, or all, of your investment amount, and may not be suitable for all investors. Prices of cryptocurrencies are extremely volatile and may be affected by external factors such as financial, regulatory or political events. Trading on margin increases the financial risks.
Before deciding to trade in financial instrument or cryptocurrencies you should be fully informed of the risks and costs associated with trading the financial markets, carefully consider your investment objectives, level of experience, and risk appetite, and seek professional advice where needed.
Fusion Media would like to remind you that the data contained in this website is not necessarily real-time nor accurate. The data and prices on the website are not necessarily provided by any market or exchange, but may be provided by market makers, and so prices may not be accurate and may differ from the actual price at any given market, meaning prices are indicative and not appropriate for trading purposes. Fusion Media and any provider of the data contained in this website will not accept liability for any loss or damage as a result of your trading, or your reliance on the information contained within this website.
It is prohibited to use, store, reproduce, display, modify, transmit or distribute the data contained in this website without the explicit prior written permission of Fusion Media and/or the data provider. All intellectual property rights are reserved by the providers and/or the exchange providing the data contained in this website.
Fusion Media may be compensated by the advertisers that appear on the website, based on your interaction with the advertisements or advertisers.
© 2007-2024 - Fusion Media Limited. All Rights Reserved.
