The market just dropped the big, ugly “C” word on us. “Correction,” that is. The old stalwart Dow Jones Industrial Average recently broke into correction territory, dipping just over 10% in two weeks before clawing a little bit of it back. Along the way, the VIX – you know, the “fear index” – spiked to its highest levels since the 2007-09 bear market.
But while many investors might see this sudden burst of volatility as a reason to run or duck for cover, I see it as a chance to go hunting in high-yield dividend stocks.
They call it a “correction” for a reason: It’s because something was broken, and a price decline fixes it. In this case, what was “broken” was the wildly overbought nature of the entire market, which I’ll show you using two charts.
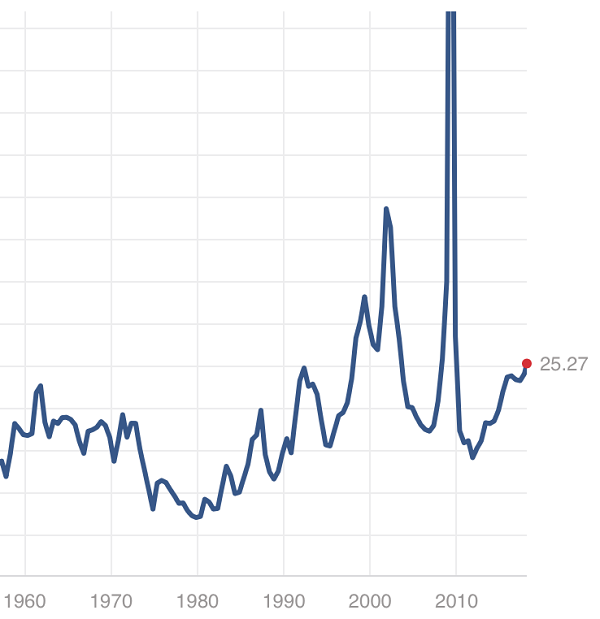
First up is a chart of the S&P 500’s price-to-earnings ratio throughout time. As you can see, the market’s valuation has reached rarefied air, with the last two such occurrences coming during the 2007-09 bear market (in which a recession blasted earnings), and the 1999-2000 dot-com bubble (including its lead-up and aftermath). Simply put: This is a pricey market.
The S&P 500 Rarely Plumps Up Like This
Source: Multpl.com
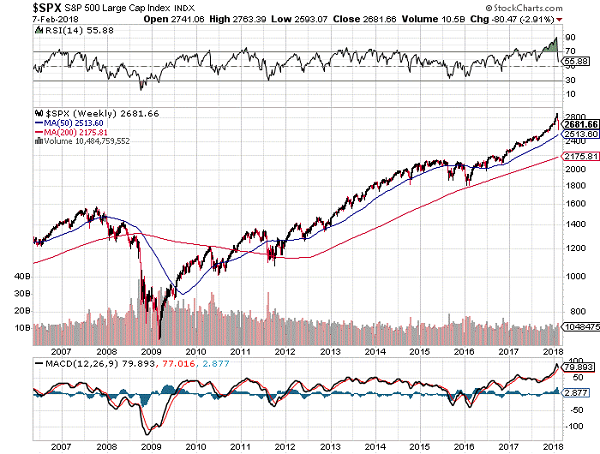
The second chart is a simple technical view of the index. On the top part of the chart, you’ll see a momentum indicator called “Relative Strength Index.” A reading above 70 is considered “overbought,” and the S&P 500 typically is good at working off this kind of condition in short order (a couple weeks to a month) by pulling back, as you can see over the past decade.
But look at how lofty things got for the past few months across 2018 and 2017, and you can see that the market was simply primed to correct.

Is the market’s overvaluation now “fixed”? Hardly. The S&P 500’s valuation still sits at a historically elevated level, but some stocks have indeed worked off some froth over the past couple days – and in some cases, the past couple of months.
Today, I’d like to show you three such stocks, yielding up to 8.4%, that have become more wallet-friendly of late.
Preferred Apartment Communities
Dividend Yield: 6.9%
We last discussed Preferred Apartment Communities (NYSE:APTS) back in June, and it proceeded to run almost 40% higher over the next five months. From that point, however, it got caught up in a REIT-sector pullback – and eventually, the market’s broader decline – dropping more than 30% through today.
Both moves were overdone. A 40% move in five months for a REIT is simply too much, too fast, but its pullback has been overwrought and begs buying once more.
A refresher: Preferred Apartment Communities (APTS), as the name would imply, an apartment property owner that boasts a presence in 13 states across the East Coast, Southeast and Midwest. The real estate investment trust (REIT) also “may make real estate loan investments in multifamily communities and other multi-family related assets, such as off-campus student housing communities.” But it goes a step farther afield from the housing business by also investing in things such as office buildings and grocery-anchored shopping centers, providing some diversification that you typically don’t see in residential REITs.
On the one hand, Preferred Apartment Communities hasn’t corrected for nothing. While shares probably were a pullback concern just because of how fast they’d shot up in such a short amount of time, there also were concerns about its growing pile of non-trading preferred shares, as well as its expansion into non-core areas such as retail and office space.
On the flip side, APTS still is a massive growth machine that posted a 40% top-line improvement in its most recent quarter, improved its FFO and has a payout ratio of just 65%. Moreover, with the recent correction, it’s now trading at less than 10 times its core funds from operations.
Consider the recent action a deserved punch of the “reset” button. This REIT still has plenty of upside.
Ryman Hospitality Properties
Dividend Yield: 4.8%
The thing with most real estate investment trusts (REITs) is that they tend to own dozens if not hundreds of properties, making it really difficult to precisely gauge the quality of their portfolio and truly understand the areas in which they have a presence.
That’s not the case with Ryman Hospitality Properties (NYSE:RHP), which has precisely four holdings – a quartet of resorts/conference centers under Marriott’s (NASDAQ:MAR) Gaylord brand, located near Nashville, Tennessee; Orlando, Florida; Dallas, Texas; and Washington, D.C.
It’s an interesting niche for a REIT in that while it’s certainly a hotel play, it’s not as vulnerable to the whims of the traveling public. Instead, demand largely comes from conferences and other planned meetings that, when they find a favorable host resort, tend to remain there for several years.
Ryman’s geographic positioning put it at the mercy of Hurricanes Harvey and Irma, which contributed to a 15% year-over-year drop in funds from operations in the company’s most recent quarter. Nonetheless, the company still is cash-rich, posting $5.38 in FFO over the past four quarters, which translates into an attractive 67% payout ratio. Moreover, thanks to a quick 10% dip since late January, it sports a plenty-reasonable current valuation of less than 13 times FFO.
PowerShares KBW Premium Yield Equity REIT Portfolio
Dividend Yield: 8.4%
Expenses: 0.35%
The clobbering in the REIT space isn’t a company here and a company there. Much of the industry has been getting pummeled amid inflation and interest-rate fears, with the investing world once again forgetting that REITs and their growing dividend payouts are well-protected against these forces over time.
That has created an opportunity that we’ve simply never seen before in the PowerShares KBW Premium Yield Equity REIT Portfolio (NASDAQ:KBWY).
The KBWY is unlike the Vanguard REIT ETF (NYSE:VNQ), Schwab US REIT ETF (NYSE:SCHH) and other basic REIT funds in that this isn’t a collection of high-market-cap real estate plays. Instead, KBWY invests in a basket of 30 small- and mid-cap REITs and uses a methodology that allocates higher weights to stocks with higher dividends. Washington Prime Group (NYSE:WPG) and New Senior Investment Group (NYSE:SNR) are the ETF’s largest weights as of this writing.
KBWY’s yield had been expanding for years thanks to good, old-fashioned dividend growth, but the recent plunge in prices has shot the fund’s annual dole to an all-time high 8.4% on a trailing 12-month basis.
Simply put: If you believe in a near-term rebound across the board, this ETF will pay you more than most to express your inner bull.
My Top Seven Dividends Paying 8%+ to Buy Right Now
I don’t mess around with expired business models. Nor do I waste time with paltry 2%, 3% or even 4% or 5% dividends!
So let’s discuss my seven top 8%+ dividends to buy right now. All of these payouts are well funded, and likely to grow in the future.
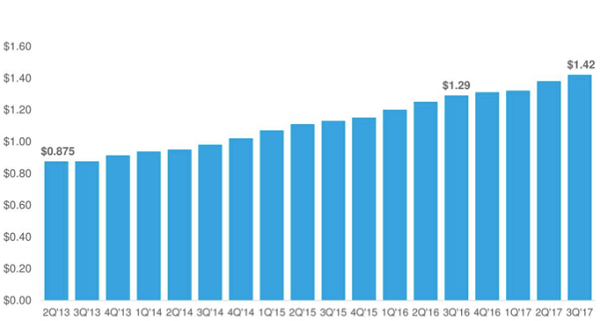
My favorite firm has now increased its payout every quarter for 17 consecutive quarters. And these have been meaningful increases with sustained momentum. The company’s most recent hike represented a 10.1% increase year-over-year:
An Accelerated Aristocrat: 17 Straight Hikes
The best time to buy a dividend grower like this is anytime. But we can tip the odds in our favor even further when we buy at moments like these – when the share price is due to “catch up” to the dividend.
There have been two great times to buy these shares in the last five years:
- Early 2016. Its stock price plunged below its ever-growing dividend, providing opportunistic investors with quick 35% price upside. And,
- Right now.
Stocks tend to appreciate as fast as their dividends. Buy a static payer, and you shouldn’t expect much upside. Buy a 10% annual dividend grower like this, and you should expect 10% price upside to go along with your 8.9% yield.
Remember, total returns are made up of dividends and price appreciation. The latter, price gains, are driven by some combination of:
- Dividend raises (which inspire investors to pay more for the stock or fund), and/or
- A climb towards fair value (a closing of the discount window in a closed-end fund’s (CEF’s) case, or a higher multiple on FFO for a REIT).
All together, my dividend superstar 7-pack yields 8.8%. And each play has price upside to boot – giving us the potential for 25% total returns or more in the year ahead.
Disclosure: Brett Owens and Michael Foster are contrarian income investors who look for undervalued stocks/funds across the U.S. markets. To learn how to profit from their strategies in the latest report, click here.
