If we can be sure of one thing these days, it’s that millions of investors are fed up with the pathetic 0.7% yields offered by so-called “safe” plays like Treasuries. And the 1.7% dividend that the average S&P 500 stock pays? Nobody’s not retiring on that, either!
So it follows that many more investors will go on the hunt for high, safe dividends in the coming months.
That means a group of 500 big yielders called closed-end funds (CEFs) will draw a lot more interest. The average CEF yields 7.2% now, and the biggest payers yield well into the double digits, like the 14.6%+ yielders we’ll dive into below. Better still, you can buy CEFs on the open market, just like stocks.
But we can’t let those high yields lull us into a false sense of security, because sometimes big yields mask big risks. So, with CEFs, as with any dividend-paying investment, we need to look beyond the current yield to make sure our payouts are safe.
Let’s do that with the five highest-yielding CEFs out there, sorted from highest yield to lowest. Their strengths and weaknesses tell us a lot about what does—and does not—make for a profitable CEF investment.
Cornerstone Strategic Value Fund
Dividend yield: 20.6%
Pros
- Very high yield
- Long history
Cons
- Frequent dividend cuts
- Underperforming the market
- Trades at a premium to net asset value (NAV)
CLM, the highest yielding CEF, is a stock-focused fund with some of the biggest names in the S&P 500 among its top-10 holdings, including Amazon (NASDAQ:AMZN), Microsoft (NASDAQ:MSFT), JPMorgan (NYSE:JPM) and Home Depot (NYSE:HD).
So far, so good. But this is where we come up against the first flaw in CLM’s strategy: it focuses on paying out a big chunk of cash to investors, regardless of the performance of its underlying portfolio, which is vital to supporting those payouts.
And since CLM consistently underperforms the market, the result has been many dividend cuts. In fact CLM has lowered its payout every single year since 2009!
CLM Buyers: “How Much Will My Dividend Drop This Year?”
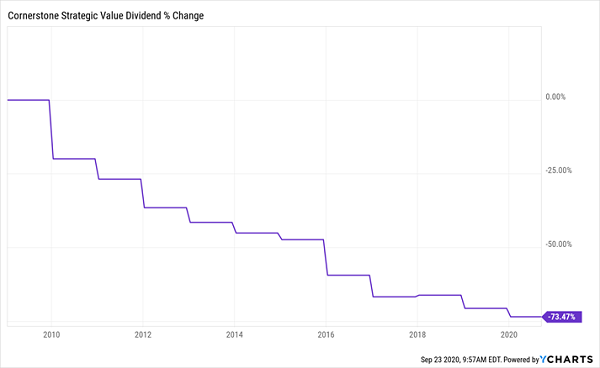
You get zero hint of this disastrous record by just looking at CLM’s eye-popping yield. Worse, the fund trades at a 13.5% premium to net asset value (NAV, or the value of the investments in its portfolio).
This means that yield-starved investors will pay upwards of $1.13 for every dollar of the fund’s assets! That’s a huge drag on further upside, and it sets you up for a steep drop when the market turns against CLM (as it has many times in the past).
Cornerstone Total Return Fund
Dividend yield: 20.3%
Pros
- Very high yield
- Nearly 50 years of history
Cons
- Like CLM, multiple dividend cuts
- Low total returns
- Trades at a premium to NAV
The second-highest-paying CEF is CLM’s sibling, the Cornerstone Strategic Return Fund (NYSE:CRF). Like CLM, it focuses on large cap stocks, with Amazon and Microsoft populating its top-10 holdings, in addition to Apple (NASDAQ:AAPL). It also has representation from the pharma and consumer staples sectors with Johnson & Johnson (NYSE:JNJ) and Procter & Gamble (NYSE:PG).
Like CLM, CRF offers a massive payout (a 20.3% yield) to investors and aims to pay out a large sum of cash no matter what happens with its portfolio. As a result, the fund is a magnet for yield-chasers and trades at a ridiculous 16.1% premium to NAV! That’s despite the fact that CRF’s history of dividend cuts goes back further than that of CLM.
Another Dividend Disaster
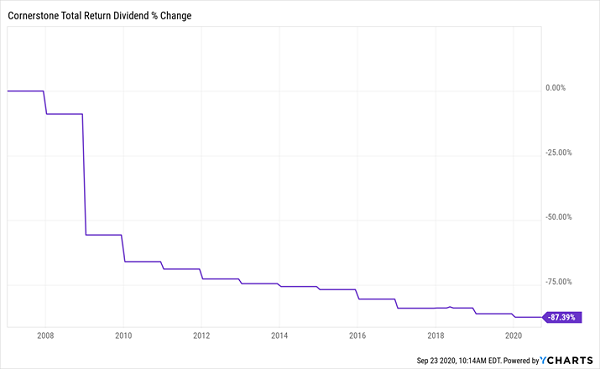
But CRF has been around for decades, which has made some investors feel comfortable that the fund will stick around for many more years, even if those years produce more and more dividend cuts! What’s more, its investors have seen returns that badly trail the S&P 500 over the long haul, even with dividends included.
S&P 500: 1, CRF: 0
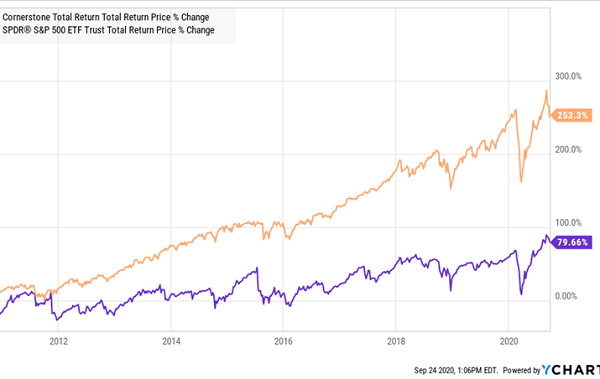
There’s no reason to think CRF’s 13-year run of decreasing dividends will end anytime soon.
Nuveen Credit Strategies Income Fund
Dividend yield: 15.9%
Pros
- Great asset diversification
- Big discount to NAV
- Large payouts
Cons
- Three dividend cuts in 2020 alone
- Poor long-term performance
- Depends on volatile junk bonds
Nuveen Credit Strategies Income (NYSE:JQC) holds corporate bonds from companies big and small, which just might make you think it’s a good way to diversify your bond holdings. And unlike CLM and CRF, JQC looks cheap, trading at a 12% discount to NAV.
There are reasons for that deal, and none of them work in our favor. One is that JQC has sliced its dividend three times in 2020 alone, for a total cut of 12%. The fund has also been volatile, including seeing its total gains over the last decade disappear during the COVID-19 pandemic over fears that junk-bond defaults would skyrocket.
JQC has also basically matched the return of the benchmark Bloomberg Barclays High Yield Bond (NYSE:JNK) over the last decade, with the ETF being a lot less volatile:
JQC’s Wild Ride
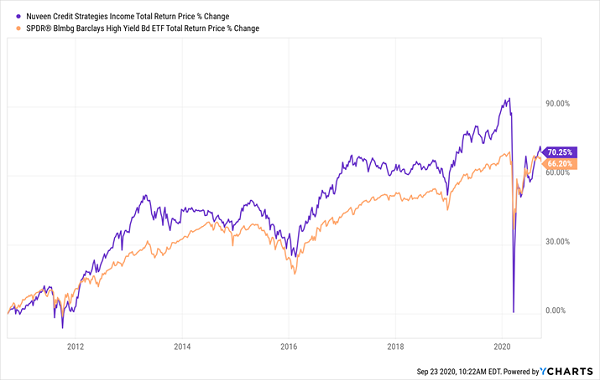
Corporate bonds are one area where active managers have an edge over the algorithms that run ETFs because they tend to get first-mover advantage when new bonds are issued. This is why most corporate-bonds regularly crush their benchmarks. Given that advantage, JQC should be doing a lot better than it is—with a lot less volatility.
ClearBridge MLP And Midstream Fund
Dividend yield: 15.5%
Pros
- Big dividends
- High-quality management
Cons
- Highly levered asset class
- Dependence on rising oil and gas prices
- High fees
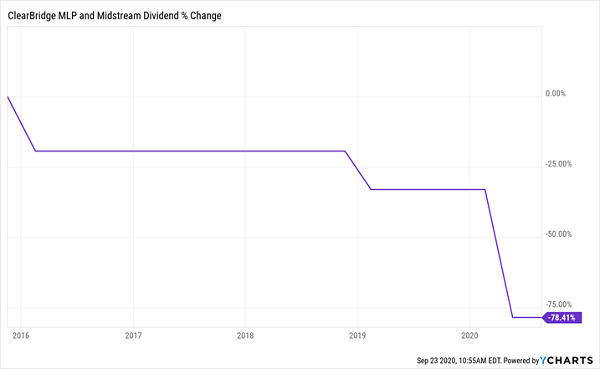
CEM’s biggest draw—and warning sign—is in its mandate: the fund focuses on master limited partnerships (MLPs), which operate oil and gas storage facilities and pipelines. That makes this fund, which trades at a whopping 24.7% discount to NAV, worth considering if you want to speculate on an oil recovery.
Unfortunately, the collapse in oil prices that started in 2014 has taken a big bite out of CEM’s dividend payouts:
CEM’s Dividend Tracks Oil—Downward
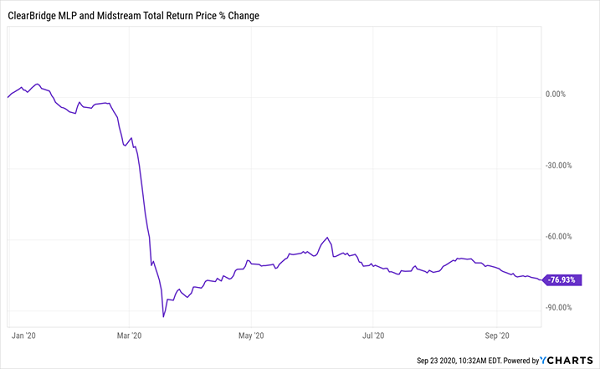
And with overall consumption down amid COVID-19 and the fast growth of renewable energy, there’s little upside for oil ahead. With no rebound, CEM’s payouts, and the MLPs it holds, face the risk of further declines, adding to the misery its investors have faced in 2020.
CEM’s Awful Year
Brookfield Real Assets Income Fund
Dividend yield: 14.2%
Pros
- High yield
- Unique strategy
- Big discount
- Broad diversification
Cons
- Market underperformance
- Dependence on real estate
Brookfield Real Assets Income RA is the most interesting of our mega-yielding CEFs. With a focus on the credit side of the real-estate world, the fund’s strategy is unusual: it focuses on bonds issued by real estate companies like American Tower Corp. (NYSE:AMT) and real estate-related assets like mortgages issued by banks and debt in hotels like Hilton Worldwide (NYSE:HLT).
This strategy has resulted in a steady dividend: RA’s monthly payout has held up nicely since its launch in late 2016, and straight through the 2020 economic collapse.
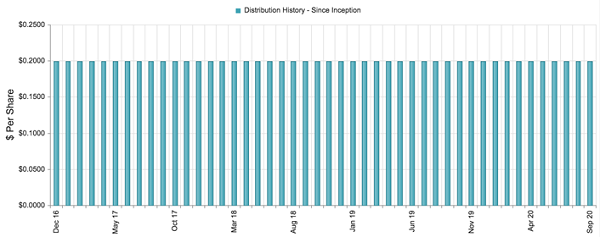
That makes RA compelling as a complement to a real-estate portfolio, especially with the fund’s 11.8% discount and 14.2% yield.
Disclosure: Brett Owens and Michael Foster are contrarian income investors who look for undervalued stocks/funds across the U.S. markets. Click here to learn how to profit from their strategies in the latest report, "7 Great Dividend Growth Stocks for a Secure Retirement."
