The monthly employment report from Australia released earlier today showed that the unemployment rate fell to 5.5% in September and down from 5.6% seen the month before. In the monthly employment change, the economy was seen adding 19.8k jobs, which was higher than the estimated 14.1k. Previous month's figures were adjusted down to show 52k jobs being added, down from 54.2k.
Data from China showed that the GDP registered a 6.8% expansion in the third quarter. This was in line with estimates, and the data comes as the China party congress gets underway.
The US dollar was seen stalling after data released yesterday showed that building permits and housing starts rose less than expected.
Looking ahead, economic data includes the UK's retail sales figures which are expected to show a decline of 0.1% on the month. The US trading session will see the weekly unemployment claims followed by the Philly Fed manufacturing index.
EUR/USD Intraday Analysis

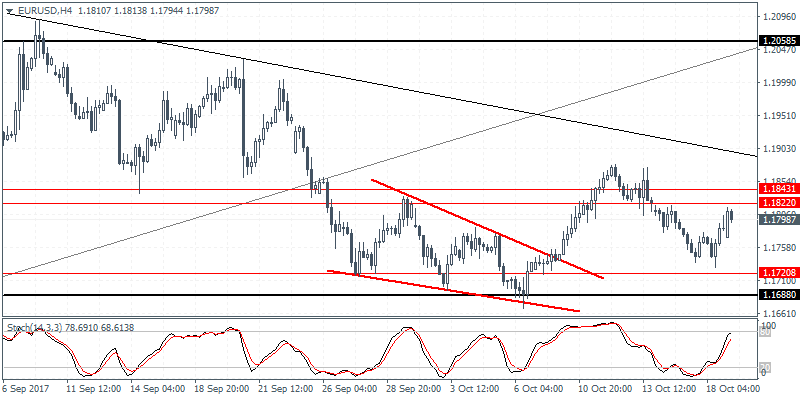
EUR/USD (1.1798):The EUR/USD managed to close on a bullish note as the common currency was seen pushing to make further gains in the early trading session today. Price action managed to recover most of the declines in the past days as the EUR/USD approaches the key resistance level of 1.1822. However, as long as price action is subdued below this resistance level, the bias remains to the downside. Support at 1.1720 will be a key level for the EUR/USD. A breakdown below this level could suggest further declines. However, we expect the sideways range to be maintained in the near term.
AUD/USD Intraday Analysis

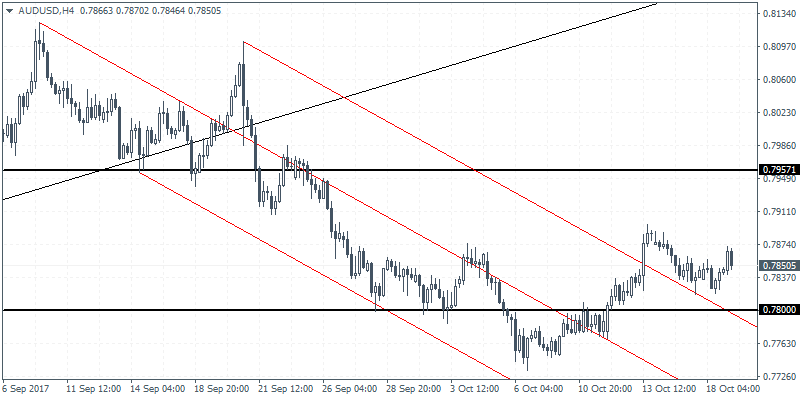
AUD/USD (0.7850):The AUD/USD was seen giving back the gains yesterday and today's price action saw prices rallying briefly. With the breakout from the falling median line, we do expect AUD/USD to push higher. However, in the near term, the downside could see prices retesting the recently broken resistance level at 0.7800. Establishing support at this price level could potentially signal a correction to the upside with 0.7957 as the eventual target. In the event that the support fails to hold near 0.7800, the bias will shift to the downside with AUD/USD likely to post further declines.
XAU/USD Intraday Analysis

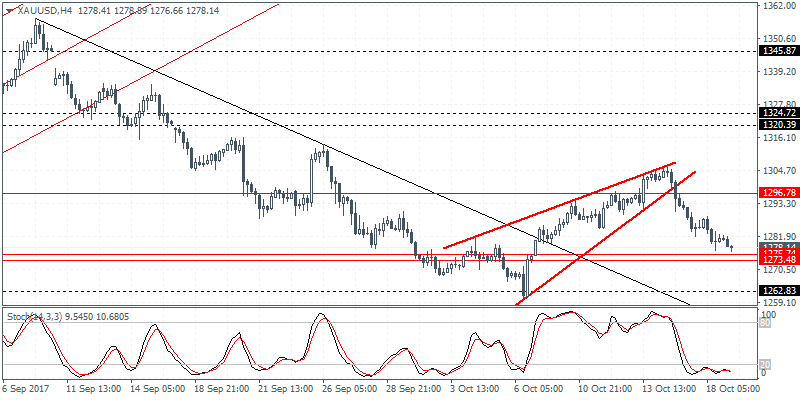
XAU/USD (1287.14):Gold prices were seen extending the declines yesterday as price approaches the support level of 1275 - 1274. The declines come following the breakdown from the rising wedge pattern and the test of support will complete the measured move. From the support level, gold prices could be seen establishing support which could see an upside bounce in prices. Resistance at 1296 will be in focus as a result, and a breakout above this resistance level is required to post further gains.
