Equity markets in Asian are trading higher mid-week as investors continue to speculate on the possibility of additional rate cuts in China. The benchmark stock index in China is now trading at its highest levels in two weeks on the expectation that the Chinese government will be forced to take steps to support economic growth throughout the remainder of the year. With very weak corporate earnings coming from many Chinese companies, the country’s central bank is now finding itself in a position where action needs to be taken to stimulate the economy, according to most analysts.
Two of the best performing sectors could be seen in insurance companies and auto makers as regional analysts have started to make comments suggesting that the Chinese government plans to take aim at certain industries (particularly health and life insurance), so one of the biggest single stock gainers was seen with China Life Insurance Co. (LFC). Other central stories came with SAIC Motor Corp. (600104.SS) and Petro China Co.,(PTR), which rose on forecasts for increases in lending and the latest rally in oil, as it now trades at its highest levels in nearly 2 months.
According to Nomura Holdings (a Japanese invest Bank), consumer lending could rise to 1 trillion yuan this month as lower interest rates stimulate borrowing with banks able to lend money at lower costs. With all of this speculation, the Shanghai Composite Index (SHCOMP) is climbing, now trading above 2,184 which is the highest level since July 6th.
Looking forward, whether or not these rallies can continue will depend heavily on the actions taken at China’s next monetary policy meeting. If the central bank decides to reduce the reserve ratio requirements for private banks (as a means for encouraging corporate lending), the latest market rally could see some extension. This is likely to filter into Asian market as a whole and this is important given the level of the MSCI Asia Pacific Index, which is currently seen at its highest levels of the month. The Shanghai Composite remains at low levels relative to its shorter term averages, now trading 11 percent below the yearly high posted on March 2nd. The Index is now valued at 9.7 times projected profits, which is well below the 17.5 average that has been seen the last half decade.
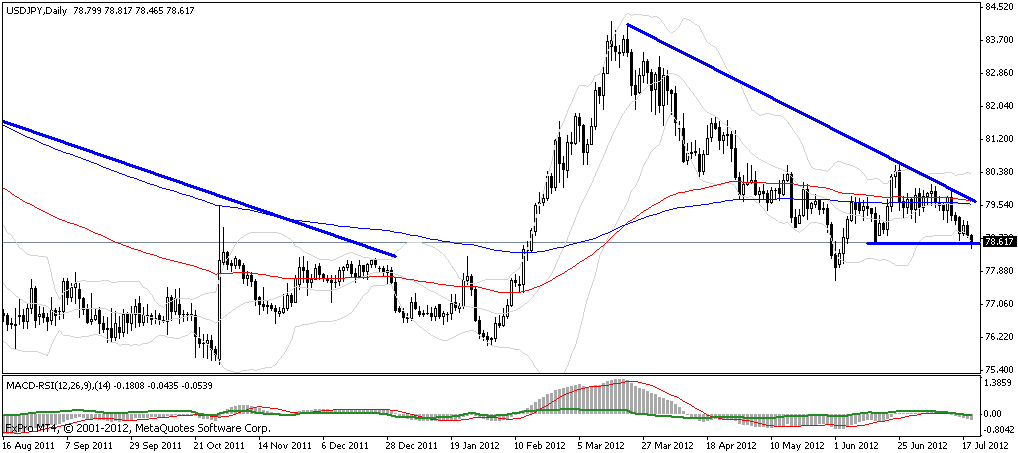
The USD/JPY is starting to look heavy once again as prices grind through support at 78.60, and an hourly close here will target an additional 100 point drop. We were starting to see a short-term uptrend channel but that has since broken and we will need to see a break of 79.90 in order to reverse the bias. Longer term, the sequence of highs is pointing toward additional weakness, so longer term buyers should wait until at least a test of 77.60 before starting to build new long positions.
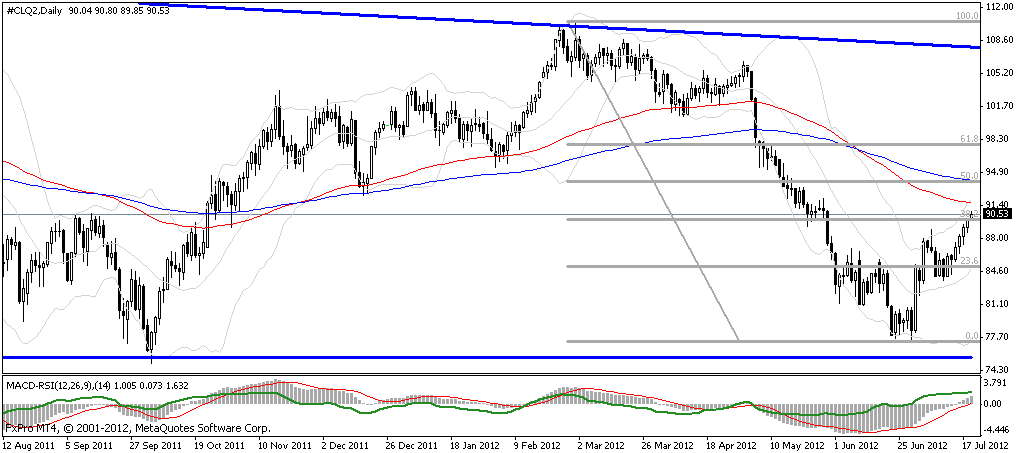
Oil is starting to rally after its latest drop and prices are now pressuring resistance that is seen at 90.15. This is also where the 100 day moving average starts coming into play, so a break here could be significant. The MACD on the hourlies is starting to cross into positive territory and the sequence of higher lows is suggestive of a major upside break in the coming sessions.
- English (UK)
- English (India)
- English (Canada)
- English (Australia)
- English (South Africa)
- English (Philippines)
- English (Nigeria)
- Deutsch
- Español (España)
- Español (México)
- Français
- Italiano
- Nederlands
- Português (Portugal)
- Polski
- Português (Brasil)
- Русский
- Türkçe
- العربية
- Ελληνικά
- Svenska
- Suomi
- עברית
- 日本語
- 한국어
- 简体中文
- 繁體中文
- Bahasa Indonesia
- Bahasa Melayu
- ไทย
- Tiếng Việt
- हिंदी
Asian Stocks Seen At Two-Week Highs On Interest Rate Expectations
Published 07/19/2012, 06:37 AM
Updated 07/09/2023, 06:31 AM
Asian Stocks Seen At Two-Week Highs On Interest Rate Expectations
3rd party Ad. Not an offer or recommendation by Investing.com. See disclosure here or
remove ads
.
Latest comments
Install Our App
Risk Disclosure: Trading in financial instruments and/or cryptocurrencies involves high risks including the risk of losing some, or all, of your investment amount, and may not be suitable for all investors. Prices of cryptocurrencies are extremely volatile and may be affected by external factors such as financial, regulatory or political events. Trading on margin increases the financial risks.
Before deciding to trade in financial instrument or cryptocurrencies you should be fully informed of the risks and costs associated with trading the financial markets, carefully consider your investment objectives, level of experience, and risk appetite, and seek professional advice where needed.
Fusion Media would like to remind you that the data contained in this website is not necessarily real-time nor accurate. The data and prices on the website are not necessarily provided by any market or exchange, but may be provided by market makers, and so prices may not be accurate and may differ from the actual price at any given market, meaning prices are indicative and not appropriate for trading purposes. Fusion Media and any provider of the data contained in this website will not accept liability for any loss or damage as a result of your trading, or your reliance on the information contained within this website.
It is prohibited to use, store, reproduce, display, modify, transmit or distribute the data contained in this website without the explicit prior written permission of Fusion Media and/or the data provider. All intellectual property rights are reserved by the providers and/or the exchange providing the data contained in this website.
Fusion Media may be compensated by the advertisers that appear on the website, based on your interaction with the advertisements or advertisers.
© 2007-2024 - Fusion Media Limited. All Rights Reserved.
