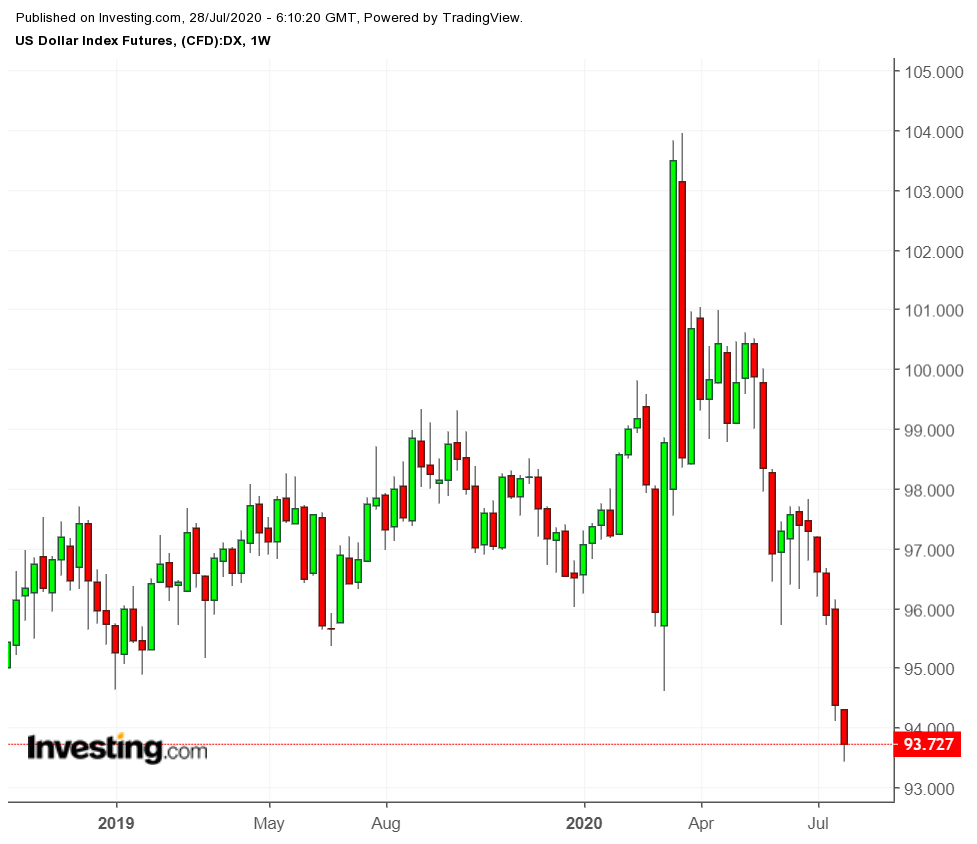
As gold and silver prices charge higher, the US dollar index dropped to a two-year low on Monday, slipping beneath 94.00.

The Index measures the value of the greenback relative to a basket of six currencies—some of the most significant US trading partners.
A volatile dollar usually influences equity returns in Emerging Markets (EM), as its value is regarded as a proxy for risk appetite and affects borrowing costs and commodity prices. All else being equal, a weaker USD is favorable for EM assets, since it decreases the debt servicing costs for international dollar borrowers. On the other hand, when the USD is robust, emerging economies pay elevated prices on imports from the US.
Equity markets stateside have outperformed many international markets over the past decade, but with a potentially lower dollar on the horizon, EMs stand to profit. Adding to the case for increased EM returns over the long haul is the emergence of the middle class consumer, one of the key growth stories in the developing world.
Still, not all emerging markets are created equal and greater gains come at more risk. Not to mention, the health and economic uncertainties from the pandemic may offset some of the benefits of a weaker dollar for EM equities. Investors should do due diligence given their specific investing circumstances. If risk tolerance permits, EM exchange-traded funds (ETFs) could add value to long-term portfolios.
Here are three EM ETFs to consider:
1. Vanguard FTSE Emerging Markets Index Fund ETF
- Current Price: $43.48
- 52-week range: $29.96-45.92
- Dividend Yield: 3.0%
- Expense Ratio: 0.10% per year, or $10 on a $10,000 investment
Vanguard FTSE Emerging Markets Index Fund ETF (NYSE:VWO) tracks the FTSE Emerging Markets All Cap China A Inclusion Index, a benchmark measuring returns of stocks issued by companies located in emerging market countries, such as China, Brazil, Taiwan, India, South Africa, and others.
VWO is well diversified with 5225 holdings. The largest five sectors by weighting include Financials, Technology, Consumer Services, Industrials, and Consumer Goods. In total, these sectors make up around 75% of the fund.
The top ten holdings comprise approximately 25% of total net assets, close to $21 billion. VWO's top five companies are Alibaba (NYSE:BABA), Tencent Holdings (OTC:TCEHY), Taiwan Semiconductor Manufacturing (NYSE:TSM), China Construction Bank (OTC:CICHF), and Naspers (OTC:NPSNY)
Year-to-date (YTD), the fund is down about 2.2%. However, since the lows of late March, VWO is up about 50%, so some profit-taking could be seen ahead. Long-term investors can find value in the fund around the $40-level or below.
2. iShares Core MSCI Emerging Markets ETF
- Current Price: $52.27
- 52-week range: $35.66-55.45
- Dividend Yield: 3.51%
- Expense Ratio: 0.13% per year, or $13 on a $10,000 investment
iShares Core MSCI Emerging Markets ETF (NYSE:IEMG) invests in 2476 large-, mid- and small-cap companies. The five most important sectors by weighting are Financials, Information Technology, Consumer Discretionary, Communication, and Materials. These sectors make up around 70% of the fund.
IEMG seeks investment results that correspond to the price and yield performance of the MSCI Emerging Markets Investable Market Index. This benchmark measures large-, mid-, and small-cap equities in the global emerging markets. The fund is currently weighted toward Asian economies.
The top ten holdings account for approximately 25% of total net assets, which are close to $52 billion. IEMG's top five companies are Alibaba, Tencent Holdings, Taiwan Semiconductor Manufacturing, Samsung Electronics (OTC:SSNLF), and Meituan Dianping (OTC:MPNGF).
For the year, IEMG is down 2.8%, but like VWO, it has had a rapid run up since the lows hit in late March, rising over 45% since early spring.
Long-term investors may consider buying into the ETF, especially if it falls below $50 or even toward $45.
3. iShares MSCI India ETF
- Current Price: $32.45
- 52-week range: $20.48-36.18
- Dividend Yield: 1.08%
- Expense Ratio: 0.69% per year, or $69 on a $10,000 investment
iShares MSCI India ETF (NYSE:INDA) tracks the MSCI India Index which measures the performance companies whose market capitalization represents the top 85% of the Indian securities market as calculated by the index provider.
The ETF invests in 86 Indian companies. The largest five sectors by weighting include Financials, Energy, Information Technology, Consumer Staples and Consumer Discretionary, making up around 75% of the fund.
The top ten holdings consist of approximately 55% of total net assets—close to $3.0 billion. INDA's top five companies are Reliance Industries (NS:RELI), Infosys (NYSE:INFY), Housing Development Finance Corporation (NS:HDFC), Tata Consultancy Services (NS:TCS), and ICICI Bank (NYSE:IBN).

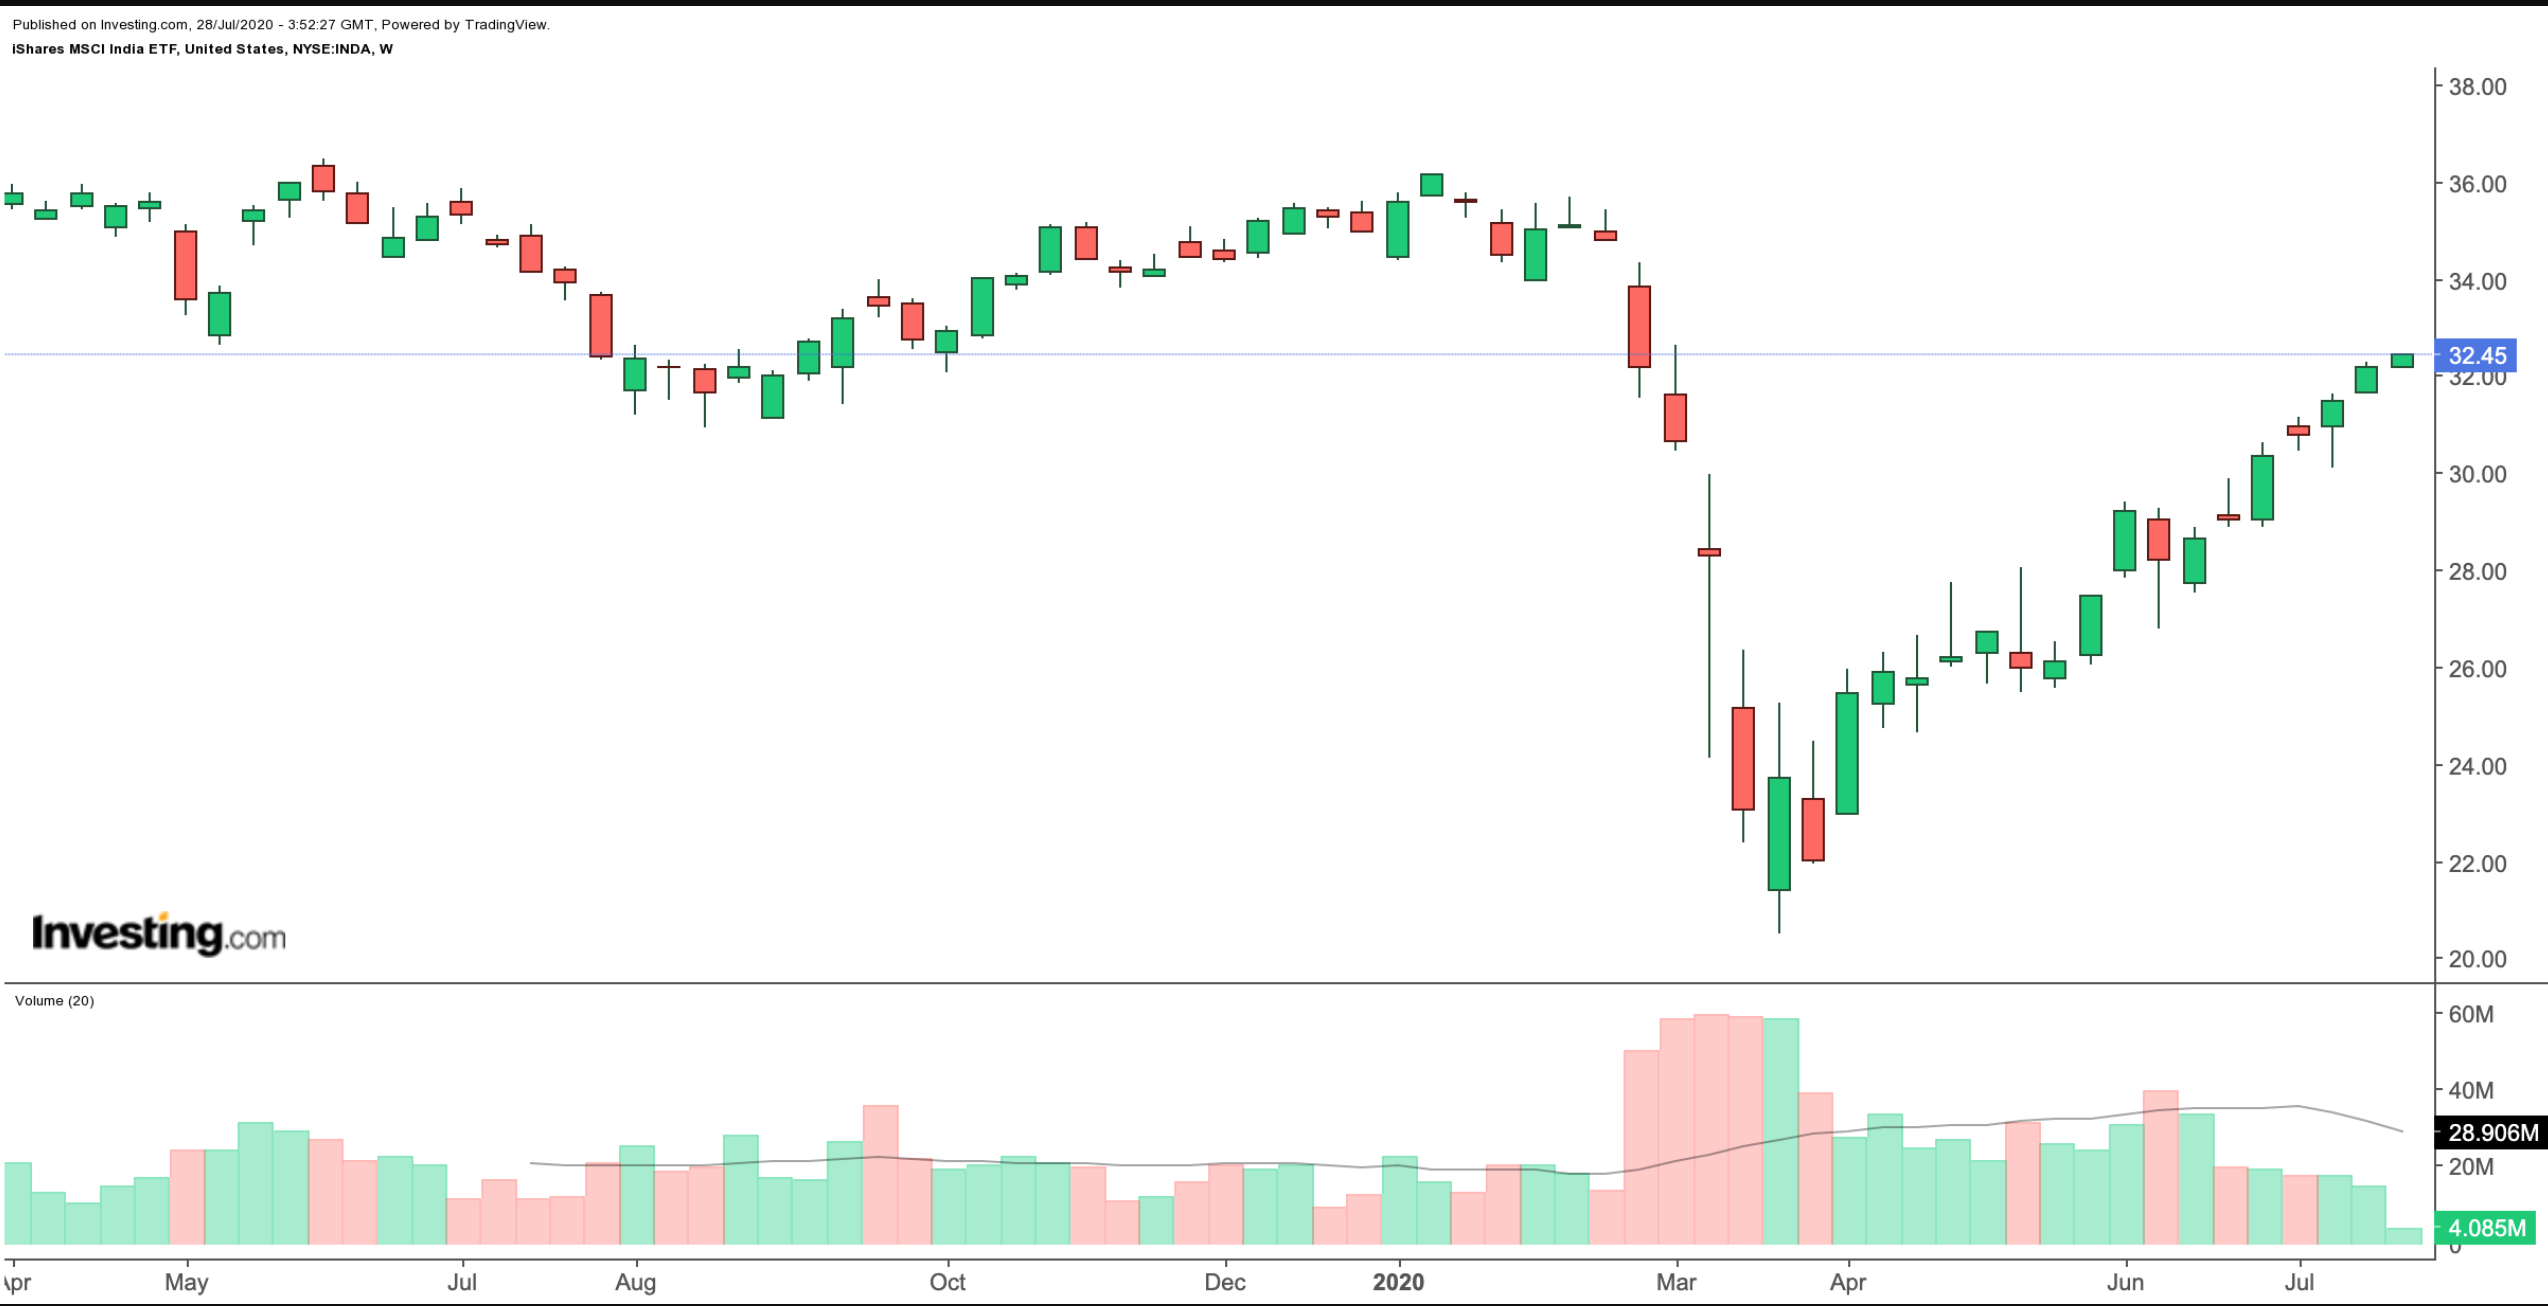
YTD, INDA is down about 7.7%, but since March, the fund has surged around 50%. Short-term profit-taking could pressure INDA toward the $30 or even $27.5-level.
