T2108 Status: 46.3% (jumped from 35.2%)
T2107 Status: 58.7%
VIX Status: 16.6 (fell 11.3% after falling 21.4% the day prior)
General (Short-term) Trading Call: bearish
Active T2108 periods: Day #96 over 20%, Day #2 over 30%, Day #1 over 40% (ending 1 day under 40%), Day #4 under 50%, Day #4 under 60%, Day #14 under 70%
Commentary
The United Kingdom has apparently already gotten over Brexit. The FTSE 100, a listing of the 100 largest stocks on the London Stock Exchange (LSE), closed HIGHER than it did on the day the UK people went to the polls to vote on membership in the European Union (EU).
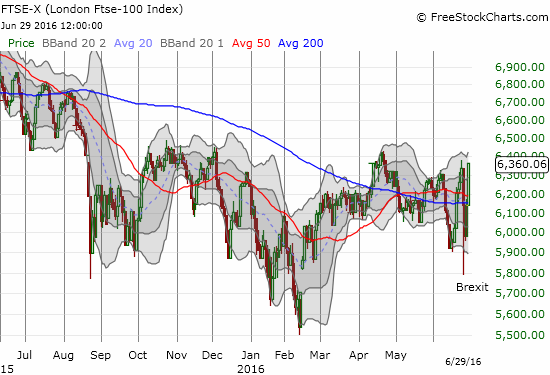
The FTSE 100 has already hurdled the Brexit hiccup
So no wonder that financial markets in the U.S. look ready to forget all about Brexit. T2108, the percentage of stocks trading above their respective 40DMAs, jumped by leaps and bounds for the second straight day to close at 46.3%.
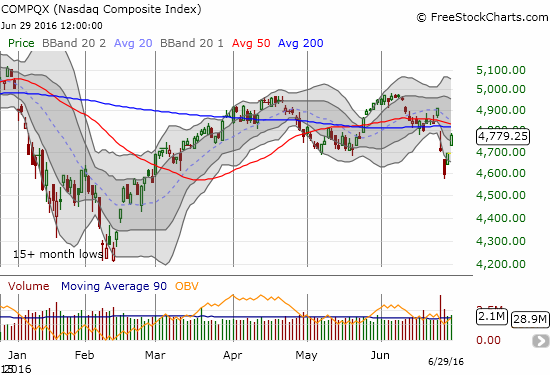
The S&P 500 (SPDR S&P 500 (NYSE:SPY)) gained another 1.7% to close just below resistance at its 50-day moving average (DMA). The NASDAQ (PowerShares QQQ Trust Series 1 (NASDAQ:QQQ)) looks ready to challenge important resistance at the converging 50 and 200DMAs.
The volatility index, the VIX, was smashed for a second straight day: it now hovers just above the 15.35 pivot in a move that says calm is quickly returning to the market.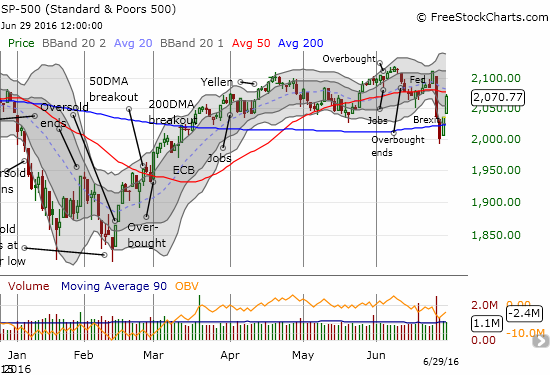
The S&P 500 (SPY) continues its sharp rebound from its 200DMA breakdown.
The NASDAQ (QQQ) stares down a critical retest of converged resistance.
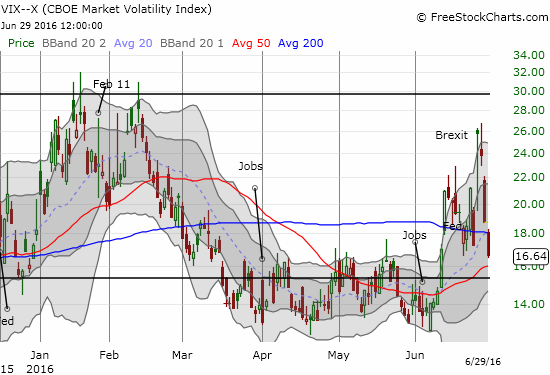
The volatility index (VIX) is over Brexit as it closed at a near 3-week low.
The fascinating part of this rapid return to normalcy is that the currency markets are far from recovered. The Japanese yen (JPY) retains much of its post-Brexit strength and the British pound (Guggenheim CurrencyShares British Pound Sterling (NYSE:FXB)) is just barely off a 31-year low against the U.S. dollar. Moreover, gold (SPDR Gold Shares (NYSE:GLD)) is still scraping at recent highs.
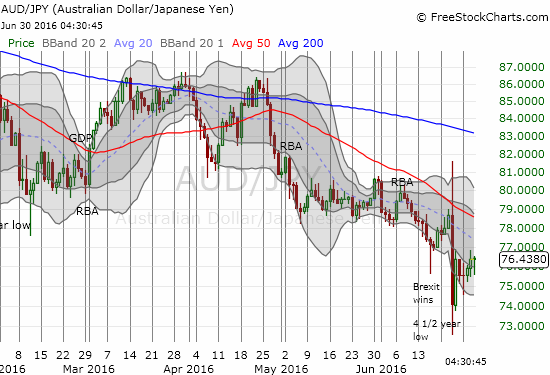
The Australian dollar versus the Japanese yen, AUD/JPY has recovered a little over half its post-Brexit loss, but it is still locked into a bearish downtrend as defined by the declining 20DMA.
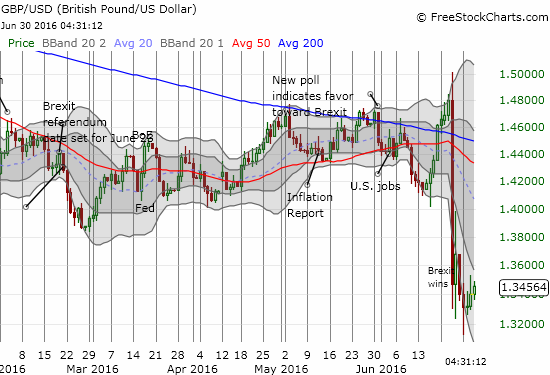
The British pound is rebounding off its historic low against the U.S. dollar, but it is nowhere near recovering a significant portion of its post-Brexit loss.
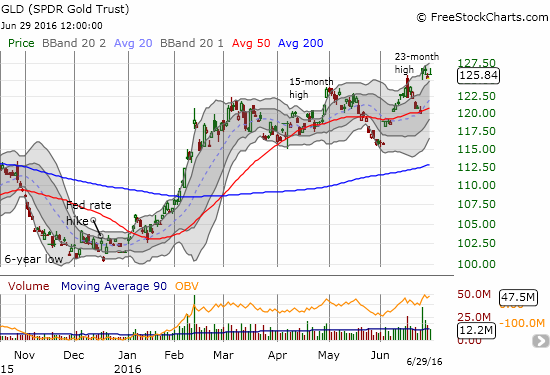
SPDR Gold Shares (GLD) is still hanging around highs last seen almost 2 years ago. Can it stay here without a new catalyst?
Finally, the market is nowhere near ready to grant the Fed pre-Brexit permission to hike interest rates anytime soon.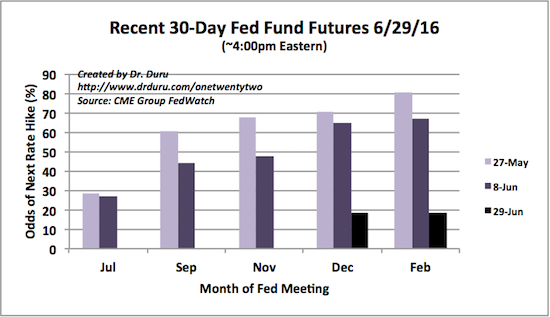
30-Day Fed Fund Futures still see Brexit as serious enough to keep the Fed on hold for quite some time…
So it seems market opinions are as divergent and contrasting as those within the UK over Brexit. However, it is hard to imagine that the volatility index will find a fresh catalyst anytime soon to challenge the recent rush higher. As a result, I am now of course relieved I closed out most of my pre-Brexit trades on Friday.
Yet I am also left wondering “what if” I had decided to close out my timely ProShares Ultra VIX Short-Term Futures (NYSE:UVXY) position instead of hedging it further (I closed out those put options today). My biggest “what if” rests with my interpretation of the quasi-oversold conditions that occurred on Monday.
I anticipated the subsequent bounce but purposely chose not to buy into the bounce. Instead, I faded the bounce with just a small amount of hedging. I did a little more of the same today with even more hedging. I now wait for a “judgement day” to occur with the S&P 500’s 50DMA resistance.
If the S&P 500 manages to close above this second resistance, I will have to upgrade my short-term trading call from bearish to neutral. Per my trading rules, I will not flip to bullish until/unless the index returns to overbought conditions.
As I review my trading decisions during this sharp bounce panicked selling conditions, I find it helpful to review the current path to bearishness. I was bearish going into Brexit not because I had a specific prediction of the outcome of the vote or the market’s reaction to it.
I flipped bearish because of T2108’s tumble from overbought conditions on June 10th. I was taken aback by the surreal rally going into Brexit but stuck to my trading call.
T2108 closed exactly at 69.99% ahead of the Brexit result, so the selling that followed confirmed the bearish trading call. If the S&P 500 closes above its 50DMA resistance, my trading call will have to retreat to neutral.
Sticking to the trading rules, I cannot flip back to bullish until/unless T2108 returns to overbought trading conditions. In the meantime, it makes sense to opportunistically nibble on a few longs mainly as hedges to my existing bearish positions.
Many stocks benefited from Wednesday’s big rally day. However, I will only cover one chart given the landscape could change dramatically with the 50DMA resistance combined with upcoming end of and start of quarter trading: Chipotle Mexican Grill (NYSE:CMG).
In the last T2108 Update, I described my renewed focus on playing the volatility in CMG. Right on time, CMG made another of those sudden surges. Despite anemic trading volume, the stock was able to gain 4.6%.
Given the trading plan, I doubled down on my calls and puts in the morning. I decided to lock in the profits on the call positions even though they just barely covered the cost of the puts. I decided it was too risky to assume that CMG could sustain the move given the apparent catalyst for the quick run-up was company news about adding chorizo to the menu in a few select markets.
This news seems pretty minor to me relative to the size of the company’s issues. The news follows the recent announcement about a new frequent dining program starting July 1st. I will be primed Thursday and Friday for making the next move. If CMG makes more progress, I will make a trade with shares instead of call options as I will want to implement a very tight stop loss.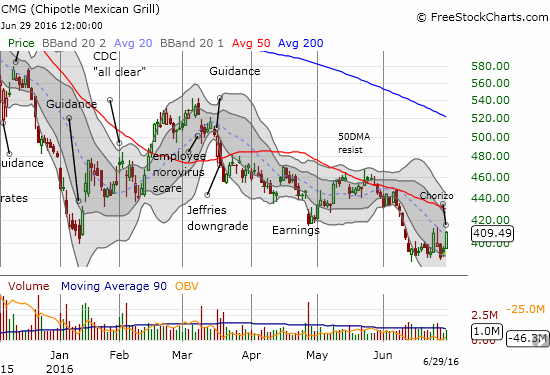
Chipotle Mexican Grill (CMG) pops yet again. News of the arrival of chorizo on the menu was enough to convince traders to hit the buy/cover button in a big way.
Daily T2108 vs the S&P 500
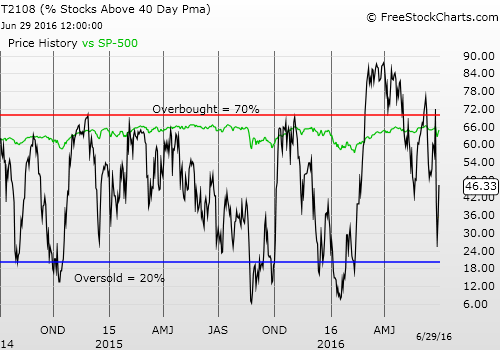
Black line: T2108 (measured on the right); Green line: S&P 500 (for comparative purposes)
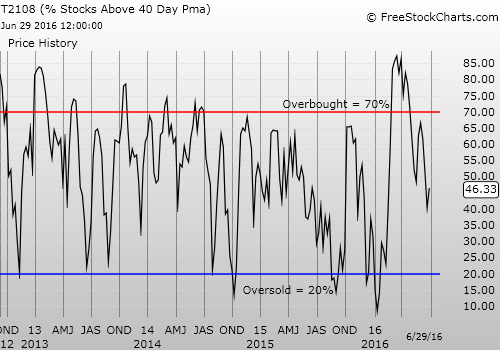
Red line: T2108 Overbought (70%); Blue line: T2108 Oversold (20%)
Weekly T2108
Be careful out there!
Full disclosure: long UVXY shares (short UVXY calls are essentially worthless now), long put options on FXY, SSO, CMG; long FXB

