
Summary:
• The stock market fell last week, with the S&P 500 down 7 points to 2833, a decline of 0.2%.
• This was led by the emerging markets, whose risks came to the fore on Friday as the Turkish Lira tanked, leading to increased concern about debt repayment.
• Our projection this week is for stocks to trade in a range, with risks increasing over the coming weeks as the current minor cycle continues.
President Trump’s trade war continued last week, as the US Trade Representative Robert Lighthizer on Tuesday published his final list of $16 billion worth of Chinese imports to be taxed.
The Chinese Ministry of Commerce responded the next day with 25% retaliatory tariffs on US imports valued at $16 billion, including automobiles and motorcycles. Yet there was little reaction in the markets, as both of these events were expected.
By Friday, though, Trump had authorized an increase of tariffs on Turkish steel from 10% to 20% and from 25% to 50% on aluminum. Referring to a series of recent events, he declared, “Our relations with Turkey are not good at this time!”
In response, the Turkish Lira sank a whopping 15% versus the dollar, and Turkish stocks (TUR) tanked 14%. Also declining were Russian stocks (VanEck Vectors Russia (NYSE:RSX)) by 3%, Chinese stocks by 1%, and the broader MSCI Emerging Markets Index (EEM) by 3%.
The concern is that the trade war may not be resolved quickly and could even spread to other emerging markets, such as Thailand, Indonesia, and India. To compound this, the US dollar index was up 1.3% on the week and 9.1% from its low of the year. A rising dollar negatively impacts emerging markets, who tend to carry a high percentage of dollar denominated debt.
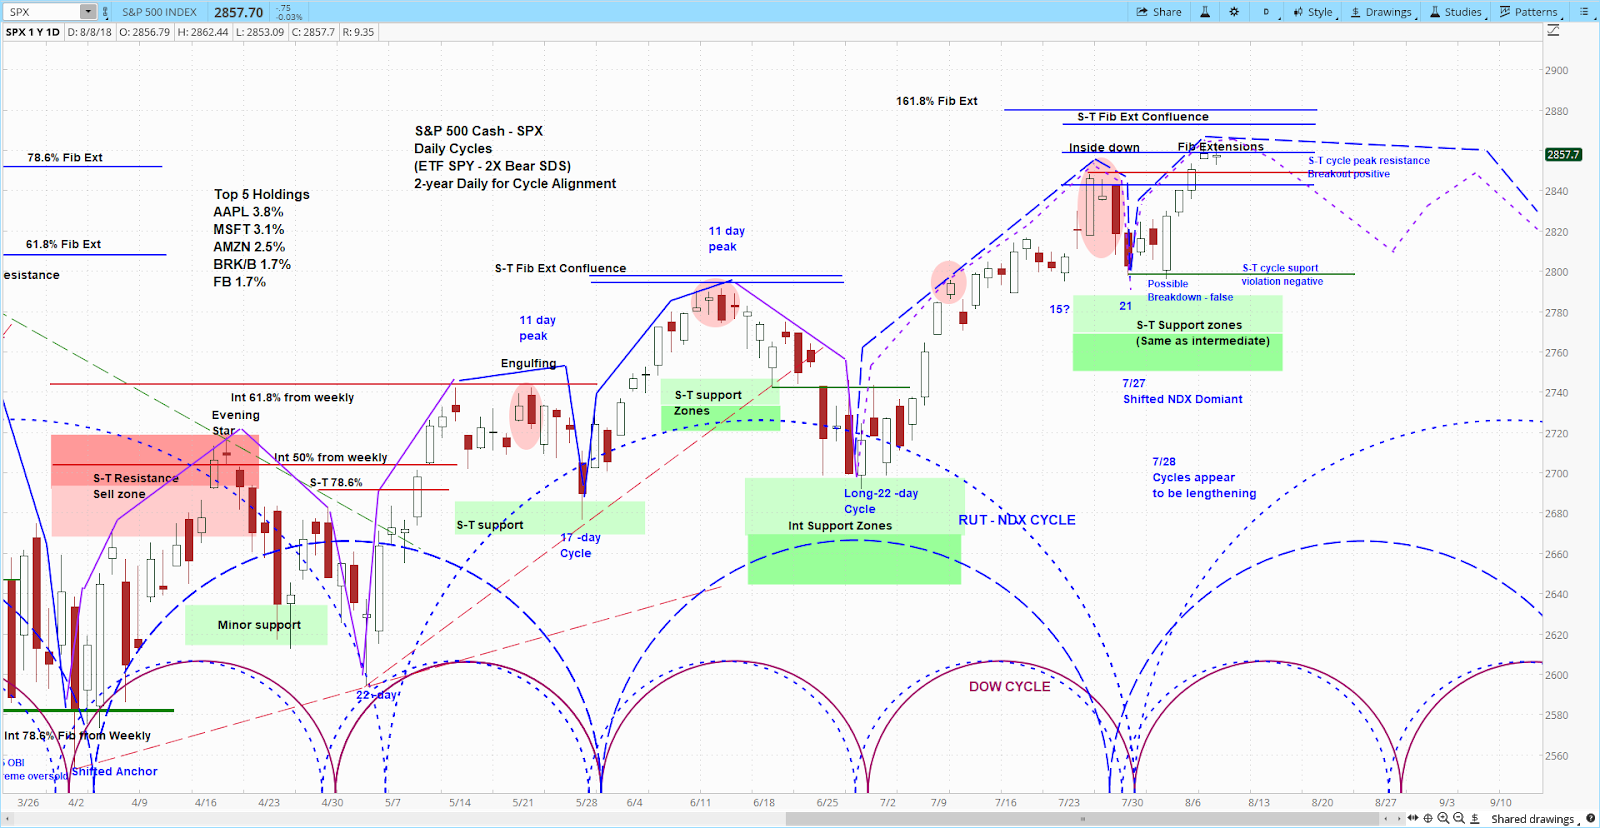
Our approach to technical analysis uses market cycles to project price action. Our analysis of the S&P 500 (SPX) is for stocks to trade in a range, with downside risk increasing in the coming weeks as the current minor cycle comes to completion.
In the meantime, we will keep an eye on the 2821 level, which is the bottom of our minor support zone. Below that, our short term cycle support is at 2798. Along with a breakdown in momentum, a move below one or both of these levels would be a bearish signal.
For more from Slim, or to learn about cycle analysis, check out the askSlim Market Week show every Friday on our YouTube channel.