Summary
In an interview today, I spoke with Equity Management Academy CEO Patrick MontesDeOca about a special weekend report for the Variable Changing Price Momentum Indicator (VC PMI) Early Bird Weekly Update he was issuing.
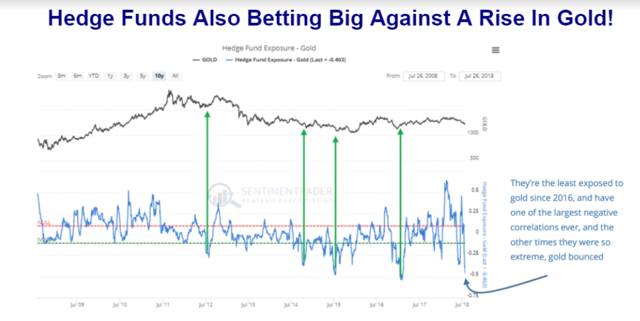
Looking at the July 26 commitment of traders report, it appears that hedge funds have bet heavily against a rise in the price of gold.
"Gold and silver hedge funds have the least exposed position to the gold market since 2016," MontesDeOca said. "We are seeing one of the largest negative correlations ever. All the other times that they were this extreme, the gold market bounced substantially."
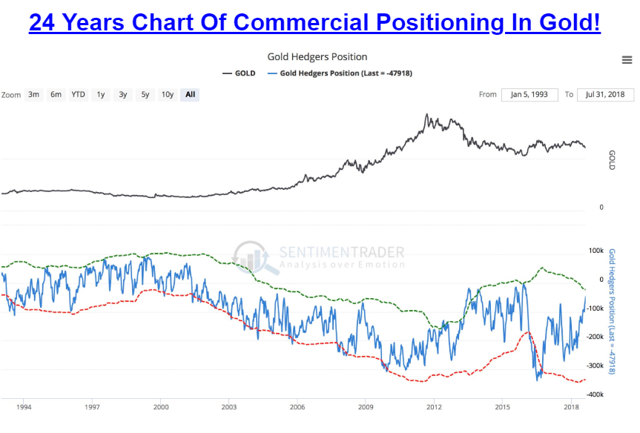
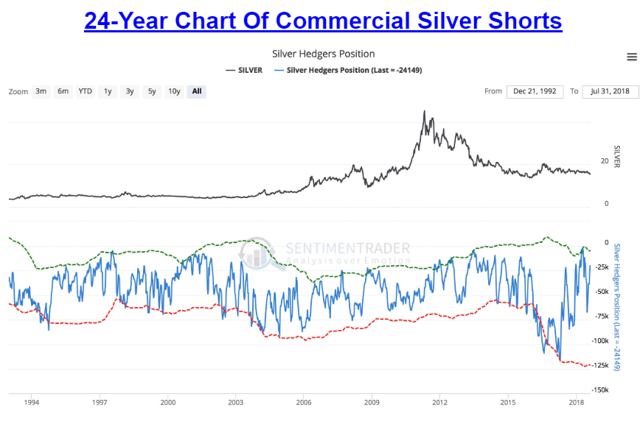
Looking at the 24-year chart, the commercials for gold and silver have reduced their short positions substantially. It appears that the central bank short strategy risk has been transferred to the spec hedge funds in the gold and silver markets.
MontesDeOca said, "This is an unusual combination that indicates the possibility that we could see a rather rapid move and an increase in the volatility of the gold and silver markets based on the possibility that the hedge funds could be short squeezed out of their positions by central bank buying the other side of the market."
In our discussion, MontesDeOca stressed, and I agree, that these are elements for an explosive market if the hedge funds have to short cover their positions in the gold and silver markets. Then, if we get additional support with central back buying, followed by speculative buying, it could make this a very interesting market for the rest of the year.
Looking at the gold and silver charts back to August 8, 2017, the gold market made a low of $1280. By September 8, 2017, we made a high of $1372, which was a $92/ounce gain in gold or approximately a 7% gain in about thirty days. In silver, on August 7, 2017, the low was made at $16.58. By August 29, 2017, silver had made a high of $18.26. That was a $1.68 gain per ounce of silver or a 10% gain in less than thirty days.
I wrote an article not long ago, on July 23, called "Can Silver Gain 15% by September 2008?" When I look at the numbers now and at the commitment of traders report, I think we are beginning to see a strong correlation that increases the probability of such a move tremendously.
Let's look at the supply and demand factors for gold and silver coming into next week so we can know what to expect next week. These numbers are to be followed on a weekly basis. Anytime the markets reach these numbers during the week, you can activate these signals as directed by the VC PMI automated algorithm.
Gold: VC PMI Analysis
Courtesy: ema2tradelivesignals.com
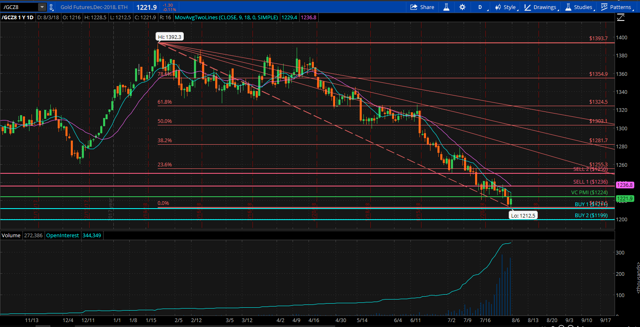
Gold closed on Friday at $1223. The average price coming into next week is $1224. With the market closing below $1224, we are coming into this week with a slightly bearish indication. But the VC PMI also tells us that if we are able to close at any time above $1224, this bearish or negative sentiment will change to neutral, and a second close above $1224 will activate the sell 1 (S1) level of $1236, and the sell 2 (S2) level of $1249.
"We recommend, based on the VC PMI," MontesDeOca said, "that if you have any positions coming into this week that you purchased at the low levels of $1215 or $1220, you should start exiting them since you are at a good profit level."
On the other hand, if we continue to follow the bearish sentiment next week, the weekly buy 1 (B1) level is $1211, which is the point at which the VC PMI algorithm recommends to cover shorts and buy into the market if it is activated this week. We recommend buying in all the way down to the buy 2 (B2) level of $1199. These are the levels of demand that have been identified in blue on the charts the Equity Management Academy provides to its subscribers. The red levels are supply levels.
The S2 level is the two-to-one implied relative volatility extreme above the mean, where there is a 95% probability of a reversion to the mean, which would bring the price back to the average price of $1224. If the market comes down into the B1 or B2 level, the B1 level has a 90% probability of a reversion to $1224, while the B2 level of $1199 has a 95% probability of a reversion back to the first target of $1211.
Gold: Fibonacci Analysis
If we take a look at the Fibonacci retracement, and at the high made at $1392 on January 24, 2018, and the recent low made this week at $1212.50, we get a 23.6% retracement at $1255. The 38.2% retracement brings us all the back to the $1281/$1282 level, while the 50% retracement brings us back to $1303. An extension of the Fibonacci retracement all the way up to 61.8% would correspond to gold reaching $1324.50. A close above $1324 would be a breakout and it would target the 78.2% retracement level of $1354.90, to the high that was made at $1392.30.
"When we incorporate Fibonacci fan lines over the work we do at the EMA," MontesDeOca explained, "using these data points, the first level of Fibonacci fan line resistance is around the $1280 level, which corresponds to the 38.2% retracement of $1282. This is a very important level to keep in mind. If the market price reaches this level, it will tell us where it wants to go once that is accomplished."
If the gold market closes above this level, it activates the upper end of the Fibonacci trend line resistance which is $1301, corresponding to a 50% retracement of $1303.
MontesDeOca said, "This is another cluster of resistance or target objectives in the pattern/structure from the high to the low made this year."
The third Fibonacci fan line resistance is at $1343.40, which matches almost perfectly the 61.8% golden ratio Fibonacci retracement of $1324.50, which is our major target in this structure for this move for the next 45 to 90 days.
Silver: Transition to a Bull Market
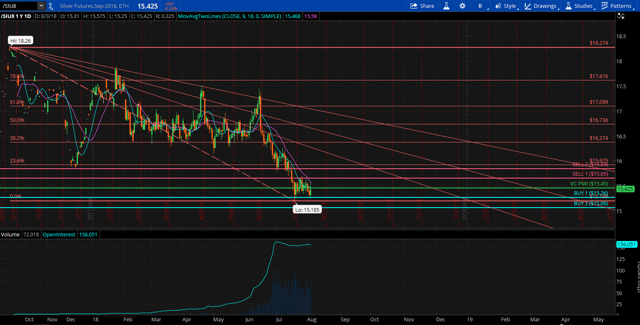
The silver market closed on Friday $15.46, and the average price coming into next week is $1545. The market closing above that mean has activated the S1 level of $1565 to $1584.
"Anytime over the next week that we accomplish these levels, if you're long from the B1 of $15.26 or the low $15.00s, this would be the area to lock in some profits as the market moves into a bullish trend," MontesDeOca advised.
Silver: Fibonacci Analysis
When we incorporate the Fibonacci retracement from the highs made on September 5 of $18.26 to the recent low of $15.1850, we can pretty much calculate the Fibonacci retracement levels and compare them to the VC PMI, as well as to the Fibonacci fan lines that we use to overlap these data points to identify the longer-term trends for the market.
The 23.6% Fibonacci retracement is at $15.93. The 38.2% Fibonacci retracement is at $15.38, and the 50% Fibonacci retracement is at $16.72. The golden ratio 61.8% retracement is at $17.10.
"These are levels," MontesDeOca said, "based on the high and the low this year, which are anticipated to unfold for the next 3 or 6 to 9 months."
When we implement the Fibonacci trend line analysis, we see that the first level of resistance is at $16.25, while the second level of Fibonacci resistance is at about $16.62, very close to the Fibonacci retracements we just mentioned. The third fan trend line is at $17.02, which almost exactly corresponds to the golden ratio of the Fibonacci retracement of $17.10.
MontesDeOca explained, "These are clusters that are targets or pivot points for the silver market. We use them to identify the specific price levels of extremes of the relative implied volatility that we expect as gold and silver transition into a bull market."
Disclaimer: The information in the Market Commentaries was obtained from sources believed to be reliable, but we do not guarantee its accuracy. Neither the information nor any opinion expressed herein constitutes a solicitation of the purchase or sale of any futures or options contracts. It is for educational purposes only.
Disclosure: I/we have no positions in any stocks mentioned, and no plans to initiate any positions within the next 72 hours.
I wrote this article myself, and it expresses my own opinions. I am not receiving compensation for it (other than from Seeking Alpha). I have no business relationship with any company whose stock is mentioned in this article.

