Get 40% Off
🤯 Perficient is up a mind-blowing 53%. Our ProPicks AI saw the buying opportunity in March.Read full update

Brent, Crude Look More Like Sludge Than Light Sweet

Published 06/02/2017, 01:01 AM
Updated 03/05/2019, 07:15 AM

A confusing night for commodities as gold trades sideways but oil falls despite a very bullish Crude Inventory Report.

Oil traders were left scratching their heads in confusion overnight as the U.S. DOE Crude Inventory Report showed much larger than expected drawdowns in crude and gasoline inventories. It should have been bullish for oil, and indeed it was for a short time, but it turned out to be a dead cat bounce with both Brent and WTI finishing in New York approximately 1.20% lower than their open.

Every rose has its thorn apparently, and in oil's case, it may well have been President Trump’s announcement from the White House Rose Garden, that the United States would leave the Paris Climate Accords. From our point of view, this could lead to a drilling free for all in the U.S. and also see other signatories waver in their commitments as well. This outcome could increase the supply side equation from the United States and complicate OPEC’s forward projections. A scenario that would not be favourable to oil prices.

Whichever way you cake the cake, however, Brent in particular and WTI both start Friday looking more like sludge than light sweet.

Brent spot opens at its New York lows at 50.10 with immediate support just below at 50.00. Behind this is plenty of clear air until the 48.00 regions. Resistance is at the 51.20 level followed by 51.50 its 200-day moving average.
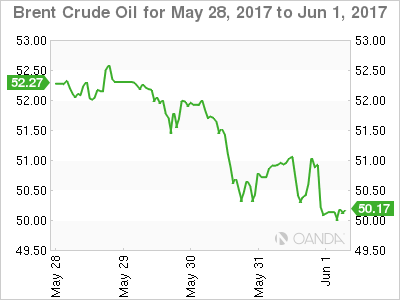
Brent Crude Oil Chart May 28-June 1

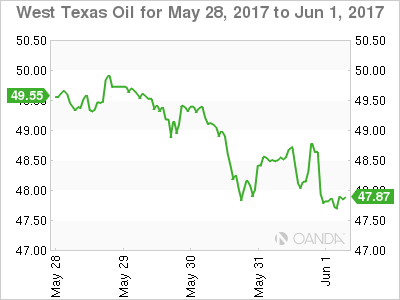
WTI spot trades at 47.75 with initial support at 47.15 before minor support appears at 45.30. Resistance is at 49.00.
3rd party Ad. Not an offer or recommendation by Investing.com. See disclosure here or remove ads .

WTI Chart For May 28-June 1

GOLD

Gold closed five dollars lower overnight, having shrugged off the worst of its overnight sell-off to post a mid-range close for the New York session. More importantly, it held the ascending trend line support at 1261.00 intraday to keep the recent uptrend intact for now. A slightly stronger U.S. dollar overnight saw gold run out of steam in the absence of any geopolitical news to cause safe haven buying.

This morning gold trades at 1263.20, resting on the abovementioned trend line, now at this level. Beyond here support appears at 1259.00 with a break below this level possibly triggering some stop-loss selling. Resistance lies at 1270.50 and then at 1274.25, Wednesday’s highs.
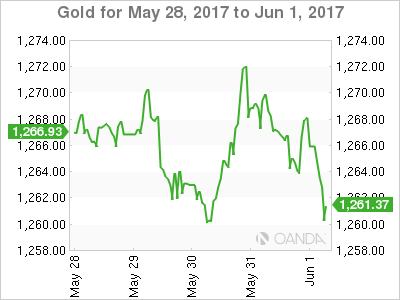
Gold Chart For May 28-June 1

Buying may emerge ahead of 1260.00, at least initially, in Asia, if we follow previous weeks recent patterns. Traders are preferring to hedge potential weekend event risk by picking up the yellow metal in Friday’s sessions.

Original post

Latest comments

Hey Marketpulse.. Thank you very much for this update, i hope you all are having a great day. I will share this post in my network...
Risk Disclosure: Trading in financial instruments and/or cryptocurrencies involves high risks including the risk of losing some, or all, of your investment amount, and may not be suitable for all investors. Prices of cryptocurrencies are extremely volatile and may be affected by external factors such as financial, regulatory or political events. Trading on margin increases the financial risks.
Before deciding to trade in financial instrument or cryptocurrencies you should be fully informed of the risks and costs associated with trading the financial markets, carefully consider your investment objectives, level of experience, and risk appetite, and seek professional advice where needed.
Fusion Media would like to remind you that the data contained in this website is not necessarily real-time nor accurate. The data and prices on the website are not necessarily provided by any market or exchange, but may be provided by market makers, and so prices may not be accurate and may differ from the actual price at any given market, meaning prices are indicative and not appropriate for trading purposes. Fusion Media and any provider of the data contained in this website will not accept liability for any loss or damage as a result of your trading, or your reliance on the information contained within this website.
It is prohibited to use, store, reproduce, display, modify, transmit or distribute the data contained in this website without the explicit prior written permission of Fusion Media and/or the data provider. All intellectual property rights are reserved by the providers and/or the exchange providing the data contained in this website.
Fusion Media may be compensated by the advertisers that appear on the website, based on your interaction with the advertisements or advertisers.
© 2007-2024 - Fusion Media Limited. All Rights Reserved.