The U.S. dollar's strength appears to confound fundamental and technical considerations. The cross-currency basis swaps have swung hard from a large dollar premium to a record discount (against the euro, sterling, and yen). No fewer than 10 central banks drew on the currency swap lines with the Federal Reserve, including three from the emerging market economies (Mexico, South Korea, and Singapore). The U.S. two-year premium has collapsed.
The Fed's balance sheet has exploded by over a trillion dollars in the past two weeks. Its asset purchase program is open-ended. The ink was hardly dry on the $2.2 trillion stimulus, and negotiations are underway for another package of around $800 bln. However, President Trump has suggested another $2 trillion may be needed for states and infrastructure. There is no end in sight.
The technical indicators were no more helpful. The U.S. dollar weakened broadly in the last week of March. The drop was sufficient to turn the momentum indicators lower. The greenback roared back as March bled into April. It gained against all the major currencies. Six of the top ten currencies fell by more than 2.5% against the dollar. Even the incredible (almost 32% in May WTI) rally in oil prices did not prevent the Canadian dollar and Norwegian krone from falling at least 1%.
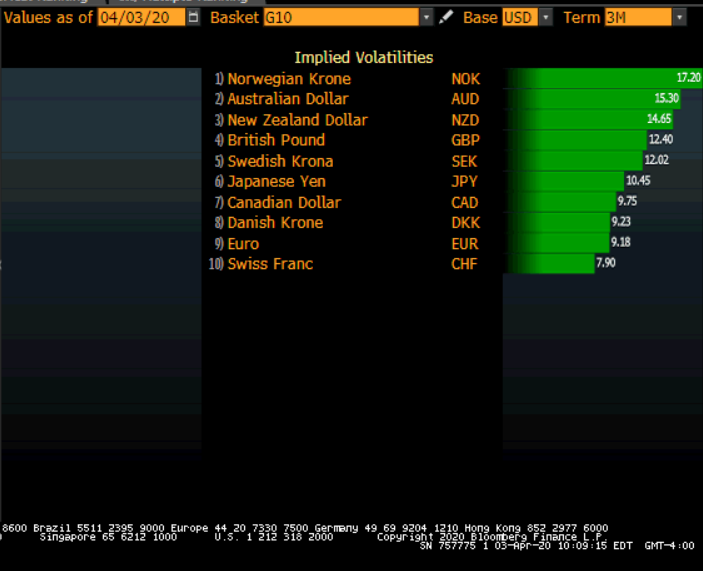
Volatility remains elevated. It is a characteristic that remains true it seems regardless of the dollar's direction. The first chart here from Bloomberg shows the implied (by the options market) volatility for the dollar against the major currencies.
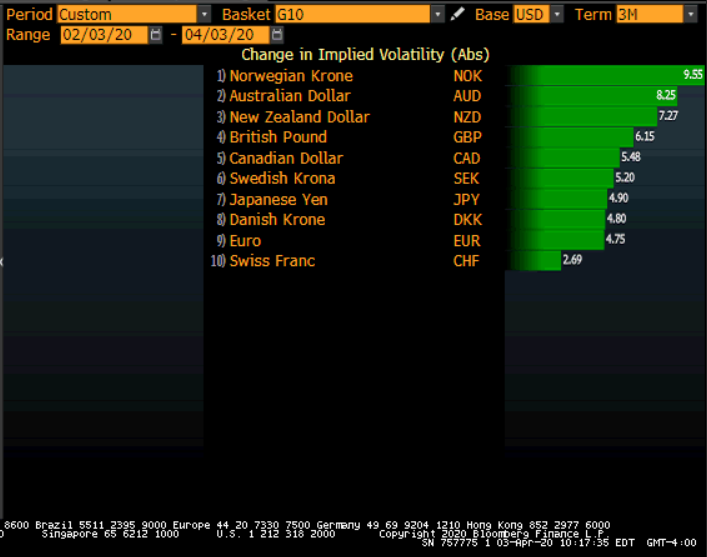
To put these readings in perspective, one needs to appreciate the change in the level. The second Bloomberg chart shows the change in volatility over the past two months.
The higher volatility requires recognition of lower confidence in demand (support) or resistance (supply). While never easy, even near-term direction and magnitudes are clearly not obvious. The markets are treacherous, making money management particularly difficult exactly when it becomes more important.
Dollar Index: The 2.5% rally last week, lifted the Dollar Index to finish the week near 100.80. It had finished the previous week 98.35. A move above 101.20 would likely signal a retest on the on March 20 near 103.00. Initial support is seen around 99.80.
Euro: The single currency could hardly sustain even the most modest of upticks last week, falling every session for a cumulative decline of about 3.2%. The bounce in the MACD is rolling back over, and the Slow Stochastic is poised to do so, as well. While there may be some support around $1.07, the risk is for a return to the recent lows seen near $1.0635. Below there, the $1.05 area is important. Resistance is seen in the $1.0850-$1.0900 band.
Japanese Yen: Knowing that foreign investors sold a record amount of Japanese bonds in the last two full weeks of March (~$56 bln) and a large amount of Japanese stocks (~$50 bln), one would still find trading the dollar against the yen challenging. The greenback both rose sharply (~JPY105 to JPY111.70) and then fell back (toward JPY107). The dollar ended a six-day slide in the middle of last week and rose by about 1.1% in the previous two sessions, and before the weekend, it settled at seven-session highs. Near JPY108.40, the dollar finished the week above the 200-day moving average (~JPY108.35) after peaking just below the (38.3%) retracement objective of the decline since the JPY111.70-area high that is found near JPY108.75. The next retracement (50%) is closer to JPY109.30.
British Pound: After five days of knocking on $1.25, market participants appeared to toss in the towel on April 2, and sterling tested $1.22 ahead of the weekend, with the 20-day moving average found near $1.2225. A break of that area could signal a move toward $1.2080 initially. Neither the MACD nor the Slow Stochastic have turned lower. From March 19 until the end of last week, the euro had fallen roughly 8% against sterling. A preliminary sign of a base near the 200-day moving average (~GBP8750) and the (61.8%) retracement objective of the rally that began from around GBP0.8275 in mid-February. The euro had spiked to GBP0.9500 on March 19 before the sharp decline.
Canadian Dollar: The U.S. dollar has steadily climbed against the Canadian dollar since reaching almost CAD1.3920 on March27. Intraday, the 20-day moving average has been consistently frayed, but the close has been above it without fail. It begins the new week near CAD1.4120. The MACD is still trending lower, while the Slow Stochastic looks poised to turn higher. After shooting up in the first half of March, the U.S. dollar is consolidating, albeit choppy and in a broad range. A move above CAD1.43 or below CAD1.40 would be a warning.
Australian Dollar: The Aussie's recovery from the $0.5510 low on March 19 fizzled at the (61.8%) retracement objective ($0.6235) of the leg lower that began near $0.6685 on March 9. It retreated to $0.5980 ahead of the weekend. A break of the $0.5945 area could spur follow-through losses toward the $0.5860 area and possibly $0.5770. A move above $0.6100 would lift the tone.
Mexican Peso: The peso lost almost 5.9% against the dollar last week. Only the Hungarian forint and South African rand fell more. Ahead of the weekend, the dollar reached MXN24.90. Although nearly every other country seems willing to take on more debt to cope with Covid-19, Mexico's AMLO is not. But, investors are not rewarding it. Mexico's two-year peso bond yield fell 23 bp last week to 6.09%. Its two-year dollar bond yield rose 19 bp to 3.31%. The greenback looks poised to challenge the record high (~MXN25.46) from March 24. A break below MXN23.00 would suggest a longer corrective period.
Chinese Yuan: As the dollar strengthened against most currencies, it was virtually flat against the Chinese yuan. It did fray the upper end of its recent range, poking above CNY7.1250 briefly on April 2, but quickly moved back. The greenback closed a little above CNY7.09. The previous two weeks, it closed at CNY7.0960. The PBOC has not been leaning particularly hard against dollar appreciation, with the reference rate set a few times above the bank models. If the dollar continues to rise broadly, the dollar may move into a new range. If, or when, the market thinks so, perhaps the offshore yuan (CNH) may move first. Watch CNH7.15.
Gold: The price of gold eased slightly last week (~0.5% or ~$7.35), but will take a three-day rally into next week. It managed to move back into the $1600-$1650 range after breaking down earlier in the week. Gold needs to establish a foothold above $1650 to be anything noteworthy. On the other hand, a move below the $1570 suggests a more complication consolidative phase.
Oil: The prospect that oil producers will cut supply sent May WTI nearly 40% over the last two sessions. It finished last week at $29 a barrel, the highest in almost three weeks. A conference call among producers is to be held at the start of next week. Disappointment could see downside pressure mount. Regardless of what OPEC+ does, several U.S. producers do appear to be cutting output. Low prices and rising storage costs impose their own discipline. The May contract closed above its 20-day moving average (~$26) for the first time since February 21. The $30.60 area is a (38.2%) retracement of last month's decline. The MACD and the Slow Stochastic are turning up from over-extended territory.
U.S. Rates: The U.S. 10-year yield fell 8 bp last week, its third consecutive weekly decline. It was the smallest net movement in six weeks. The yield slipped below 60 bp but did not fall below 56 bp. The June futures contract is pushing against resistance near 139-16. The MACD has flatlined, while the Slow Stochastic is trending higher. The flat performance in the face of both the weekly jobless claims and the monthly job report seems to suggest that the market has discounted a great deal of bad economic news. The Federal Reserve's balance sheet expanded by $1.1 trillion in the past two weeks. To put it in context, consider that under the ECB's bold and flexible Pandemic Emergency Purchase Program, it will purchase 750 bln euros (~$810 bln) of debt over the remainder of the year. The Federal Reserve announced it will scale back its Treasury purchases to $50 bln a day from $60 bln the last two sessions. As it relaunched its QE, it was buying $75 bln of Treasuries a day. Foreign central banks liquidated $24 bln of Treasuries that they hold in a custody account with the Federal Reserve. It was the fifth week of sales, over which time about $133 bln of Treasuries were sold.
S&P 500: In the last 15 sessions of the S&P 500, there has only been one with a net change of less than 1%. After rising more than 10% in the last full week of March, the benchmark fell by about 2.1% in the most recent week. The S&P 500 gapped lower in the of the week and entered the gap in the two subsequent sessions, but a gap remains (~2538.2-2571.2) that is an important technical hurdle to the upside. The 50-day moving average has crossed below the 200-day moving average (Golden Cross or Dead Man's Cross). The last time it broke below was in early December 2018 and the S&P 500 bottomed about three weeks later, though the 50-day moving average did not cross back above the 200-day moving average until the end of Q1 19. The narrow ranges that have prevailed over the past few sessions have seen the VIX fall a little below 47%, its lowest closing level since March 10. Follow-through losses at the start of the week ahead could turn the momentum indicators. Initial support for the S&P 500 is seen near 2420 and then 2365.


