Monero
I applied the following tools: candlestick analysis, all-round market view, market balance level, oscillators, graphic analysis, trading volume.
I go on attentively monitoring confidential cryptocurrencies, and this time, I’d like to analyze the pair of Monero against the US dollar. For those, who have only recently entered the world of cryptocurrencies, I’ll explain that, since early 2018, this type of altcoin has been suffering from strong pressure. First, from the falling bitcoin, next from news about a possible ban on anonymous coins in some countries, including Japan.
The exact date of the ban is June 18. From this date, every cryptocurrency exchange in Japan is ordered by the regulator to stop trading Monero (XMR), Zcash and Dash. On the other hand, there is some positive news about XMR. Huobi is enlisting Monero; and this altcoin is supported by the Waves platform. In the context of delisting this crypto asset by Japan’s exchanges, this information is very timely and provides a significant support.
Summary
Monero is under strong pressure of international prosecution against anonymous cryptocurrencies. Nevertheless, the recent news can’t be called negative. Here, it is important to emphasize that XMR coin is being advanced and improved all the time. Finally, we can’t define whether the fundamental factors are bearish or bullish, and so fundamental analysis suggests a sideways trend.
What will technical analysis suggest to this effect? Let’s see below.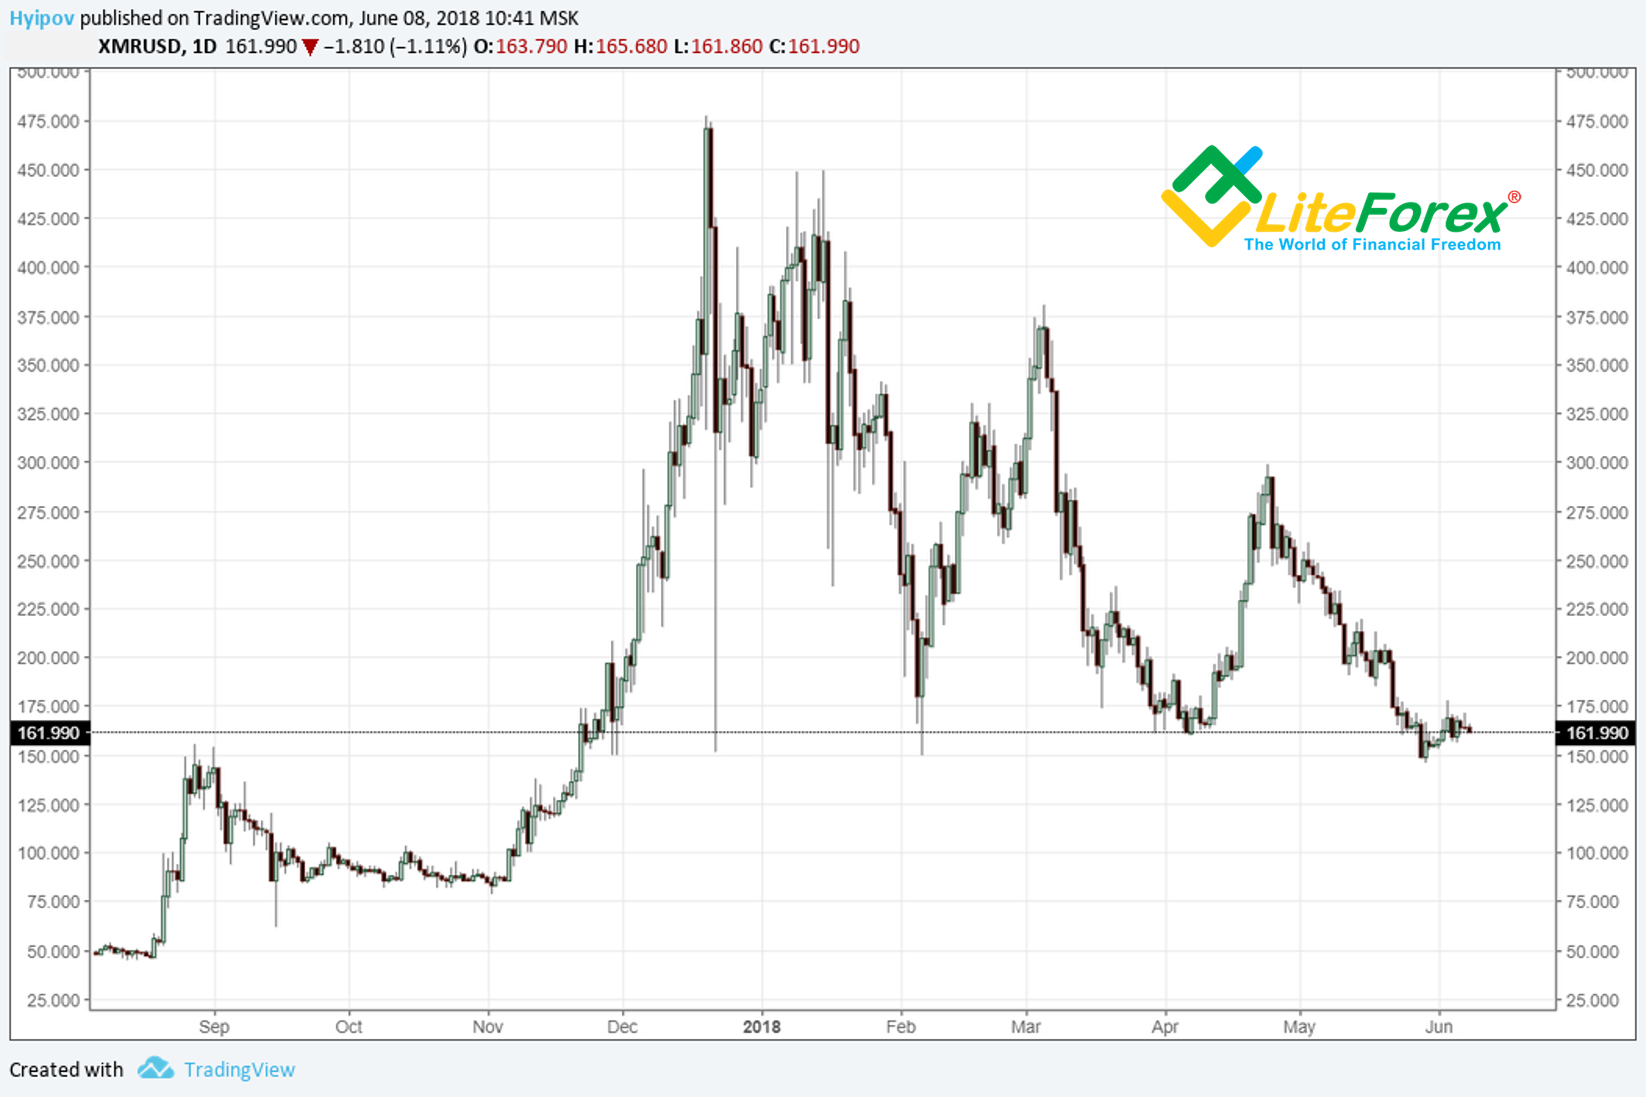
As you see in Monero's chart above, each try to step up was brutally rebuffed by large sellers, and so the price won’t grow in the near future. To mark the key support and resistance levels, let’s start with the monthly time frame.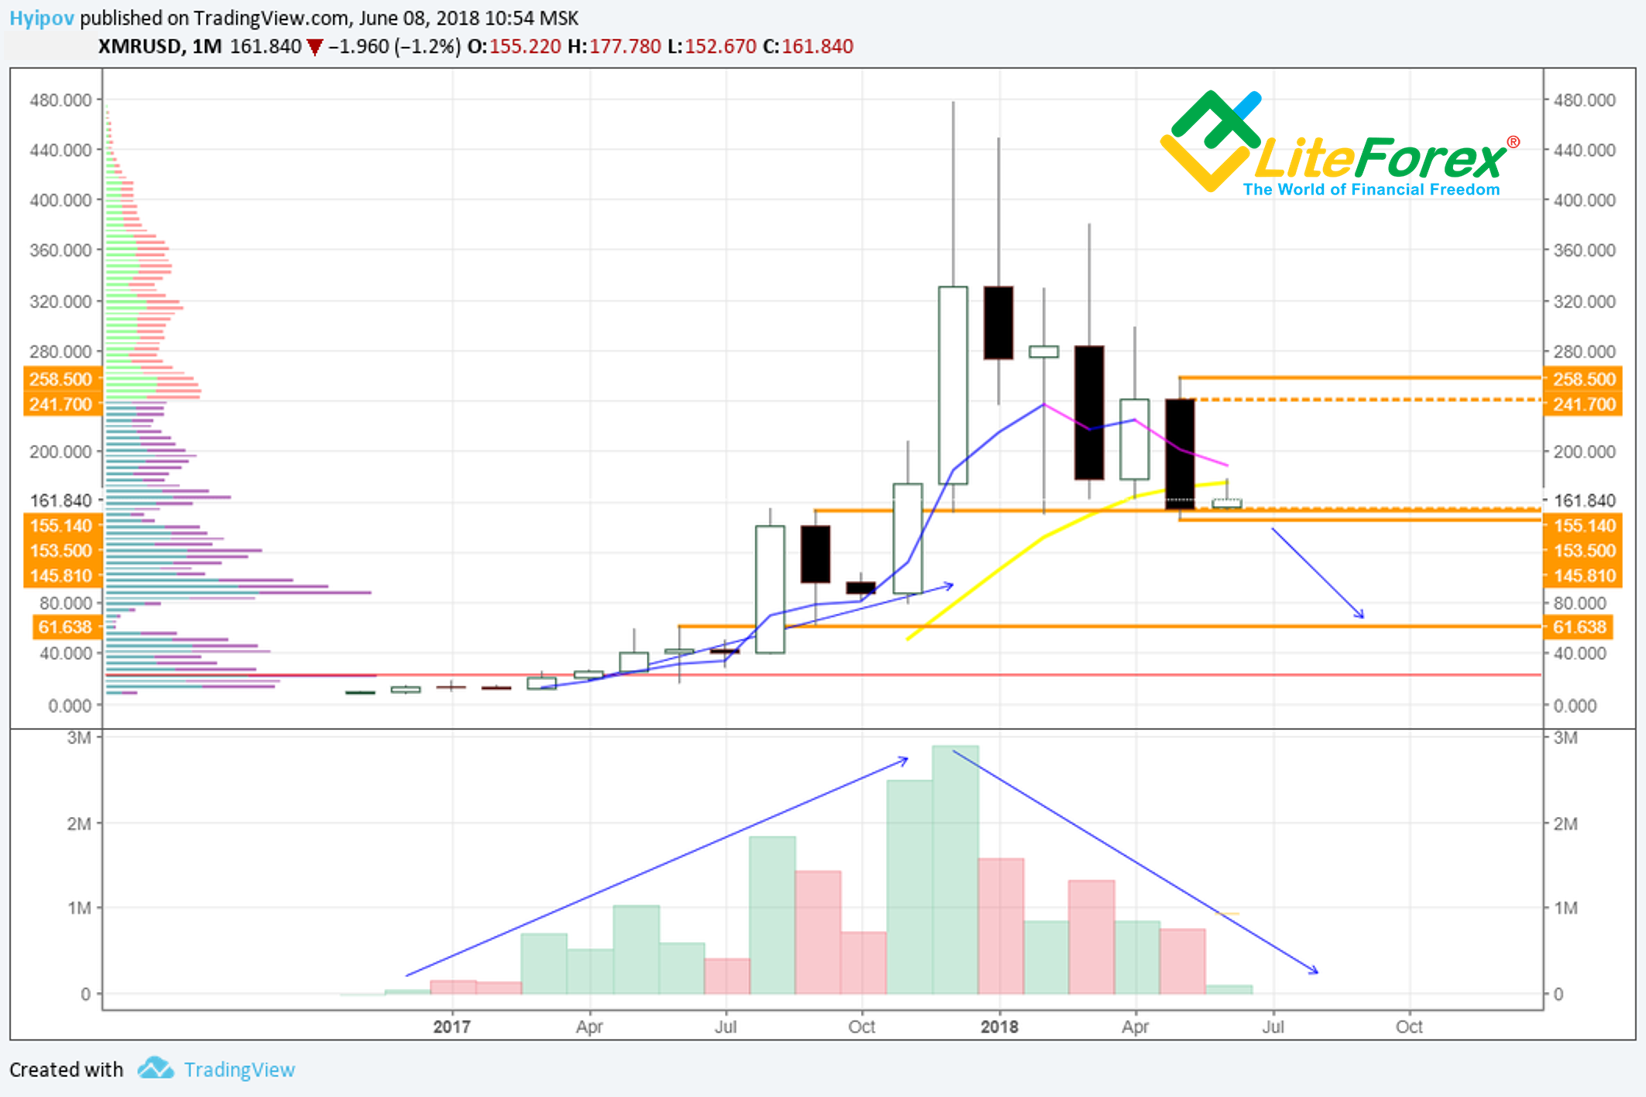
First of all, such key levels are last month’s extremes; I marked them with orange lines. Open and close levels of the previous candle are marked with dots. In addition, I marked September’s high, that was the previous bullish trend’s peak, and now, it is the strong support level. As you from the chart above, since 2018, the XMRUSD is going down, accompanied by the volume decline by the month; it indicates that there is no really bearish trend and the sideways trend is emerging. In this situation, the current support level 145 USD can hardly be broken out. Nevertheless, it can’t be totally ruled out, and so, if the price goes lower, you must be prepared to witness XMR/USD at 61.6 USD.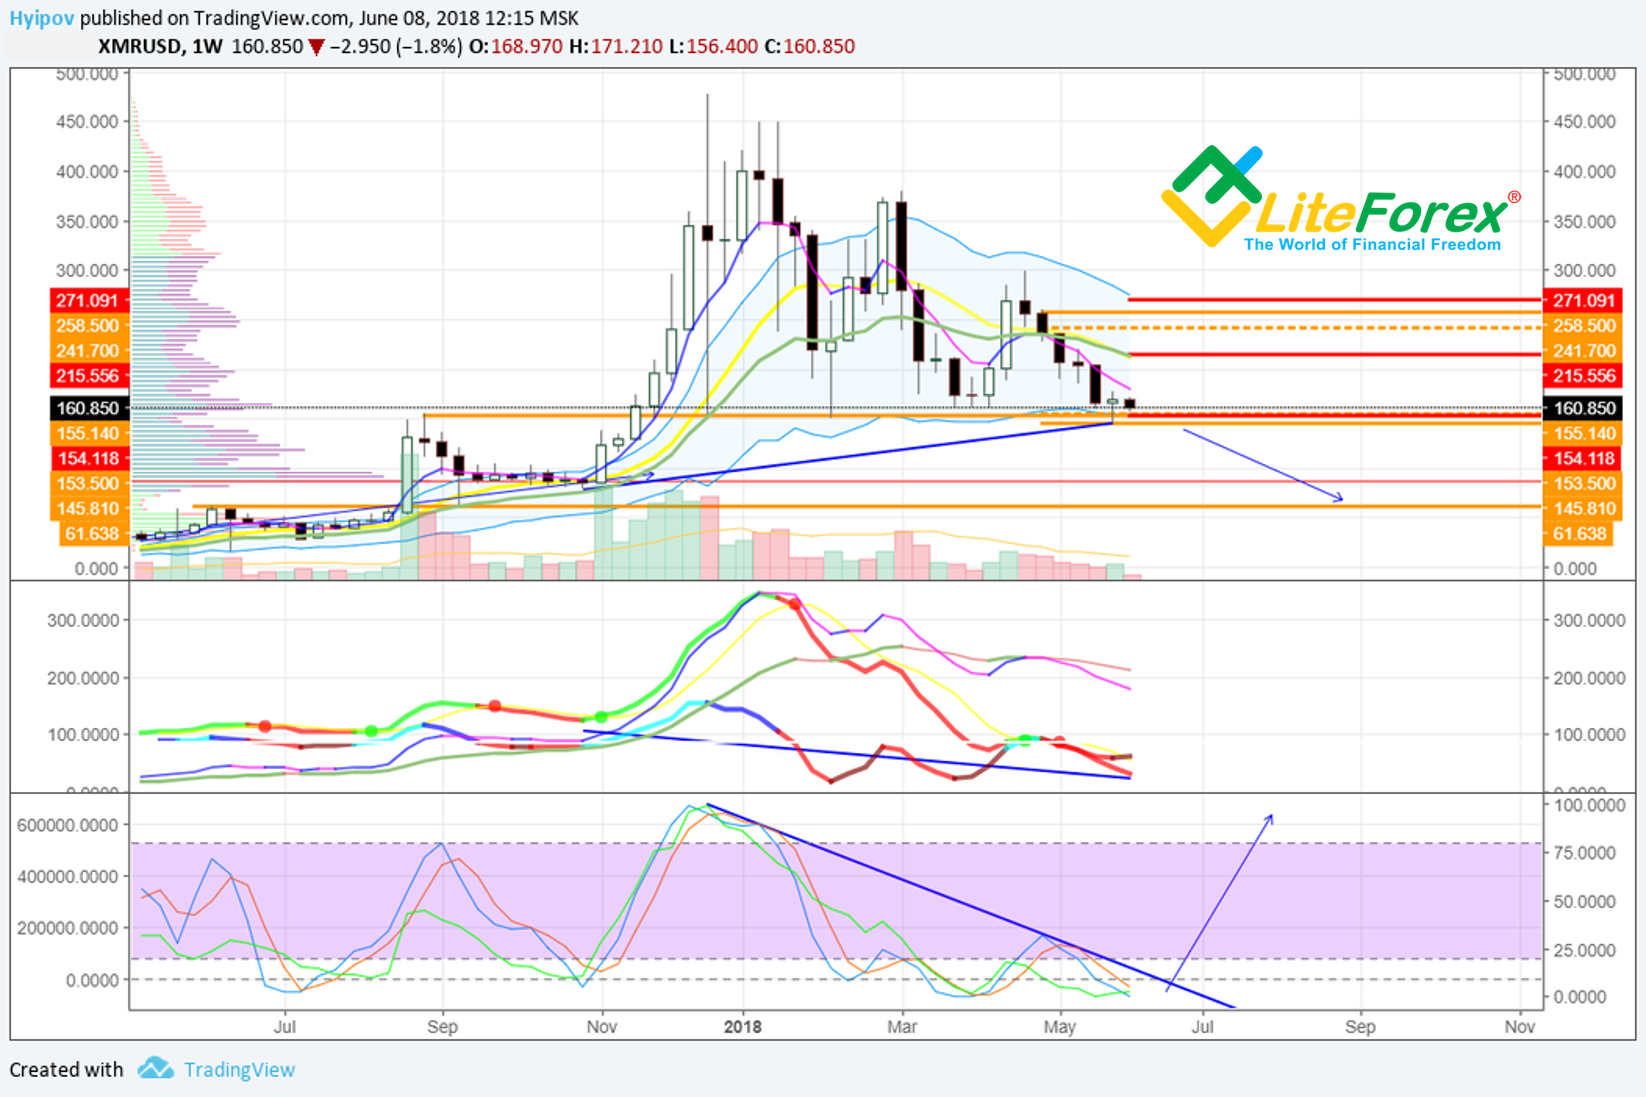
At the next step, in the weekly chart, I add Keltner channel’s borders to the general support levels at 145-155 USD. The market balance level of the channel is at about 215 USD, and its top border is at 271 USD. Channel’s borders are getting closer, which also proves trading flat. MACD and RSI oscillators are at the window bottom border and indicate strong overbought. MACD indicates bullish hidden divergence emerging.
RSI stochastic is shrinking in the window bottom part, which suggests a jump in the direction, opposite to the overbought.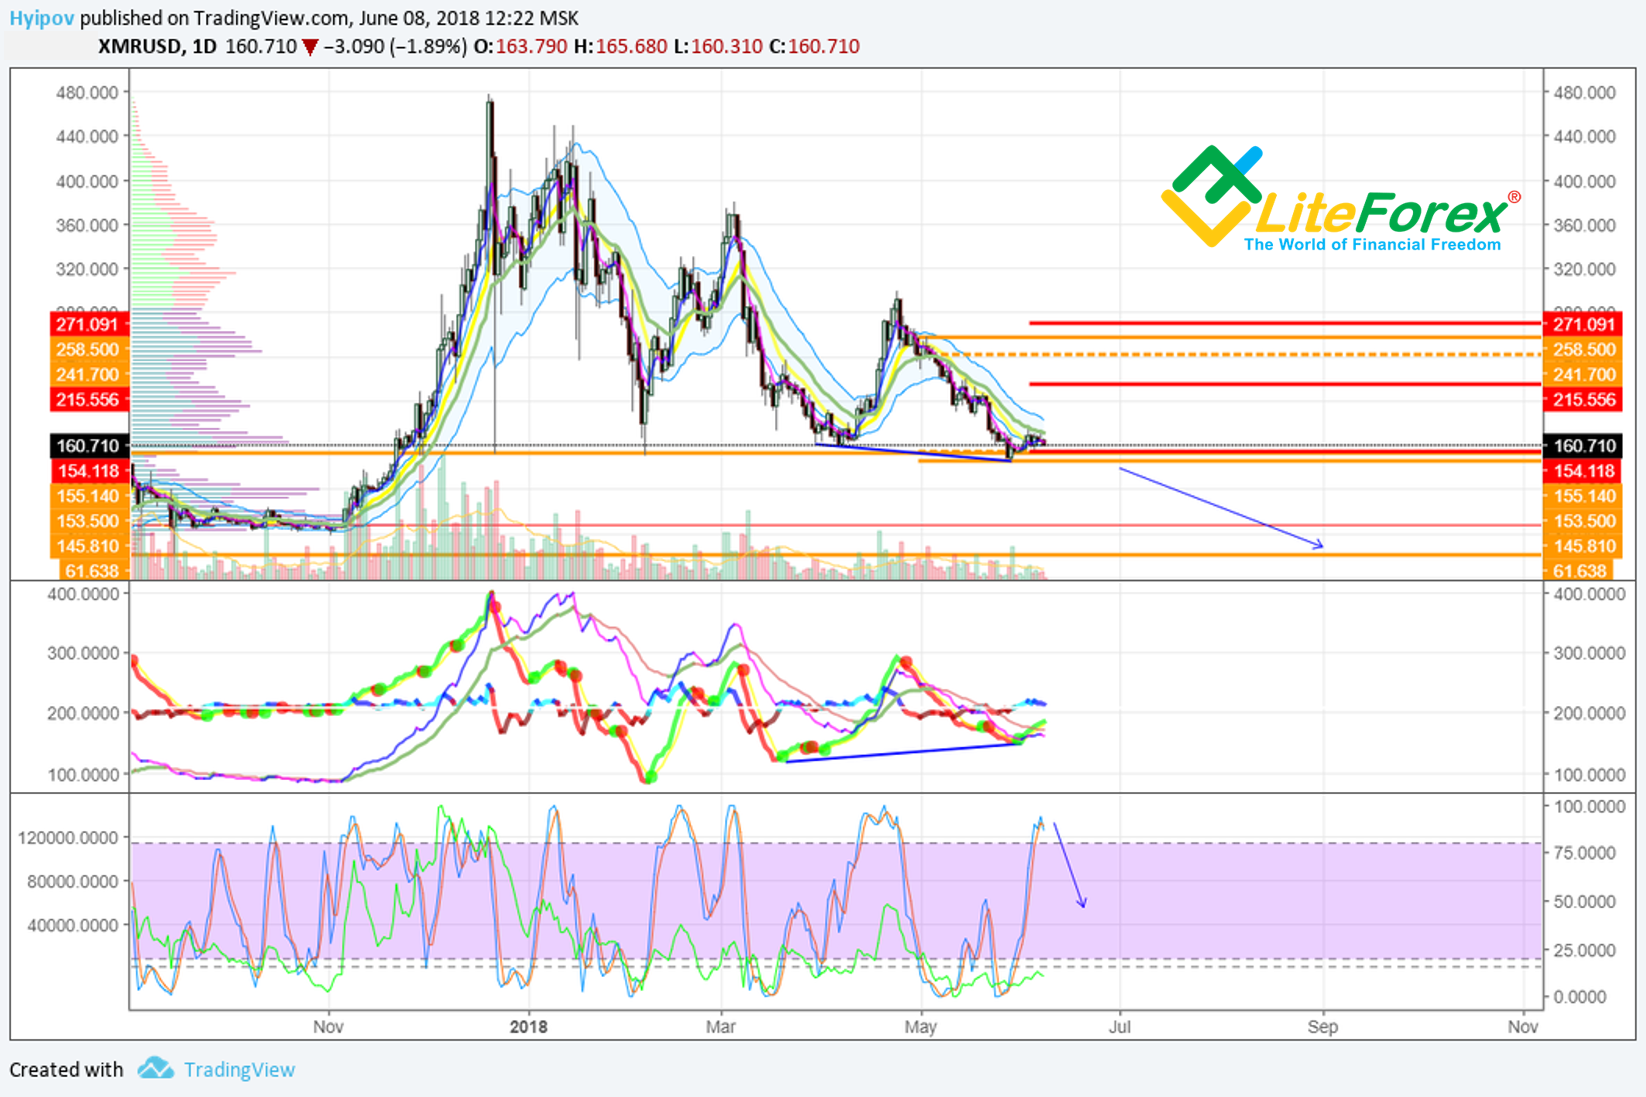
In the daily chart above, you see bullish divergence; however RSI stochastic is in the overbought zone. It means the divergence signal, suggesting a rise, is put off till a better moment.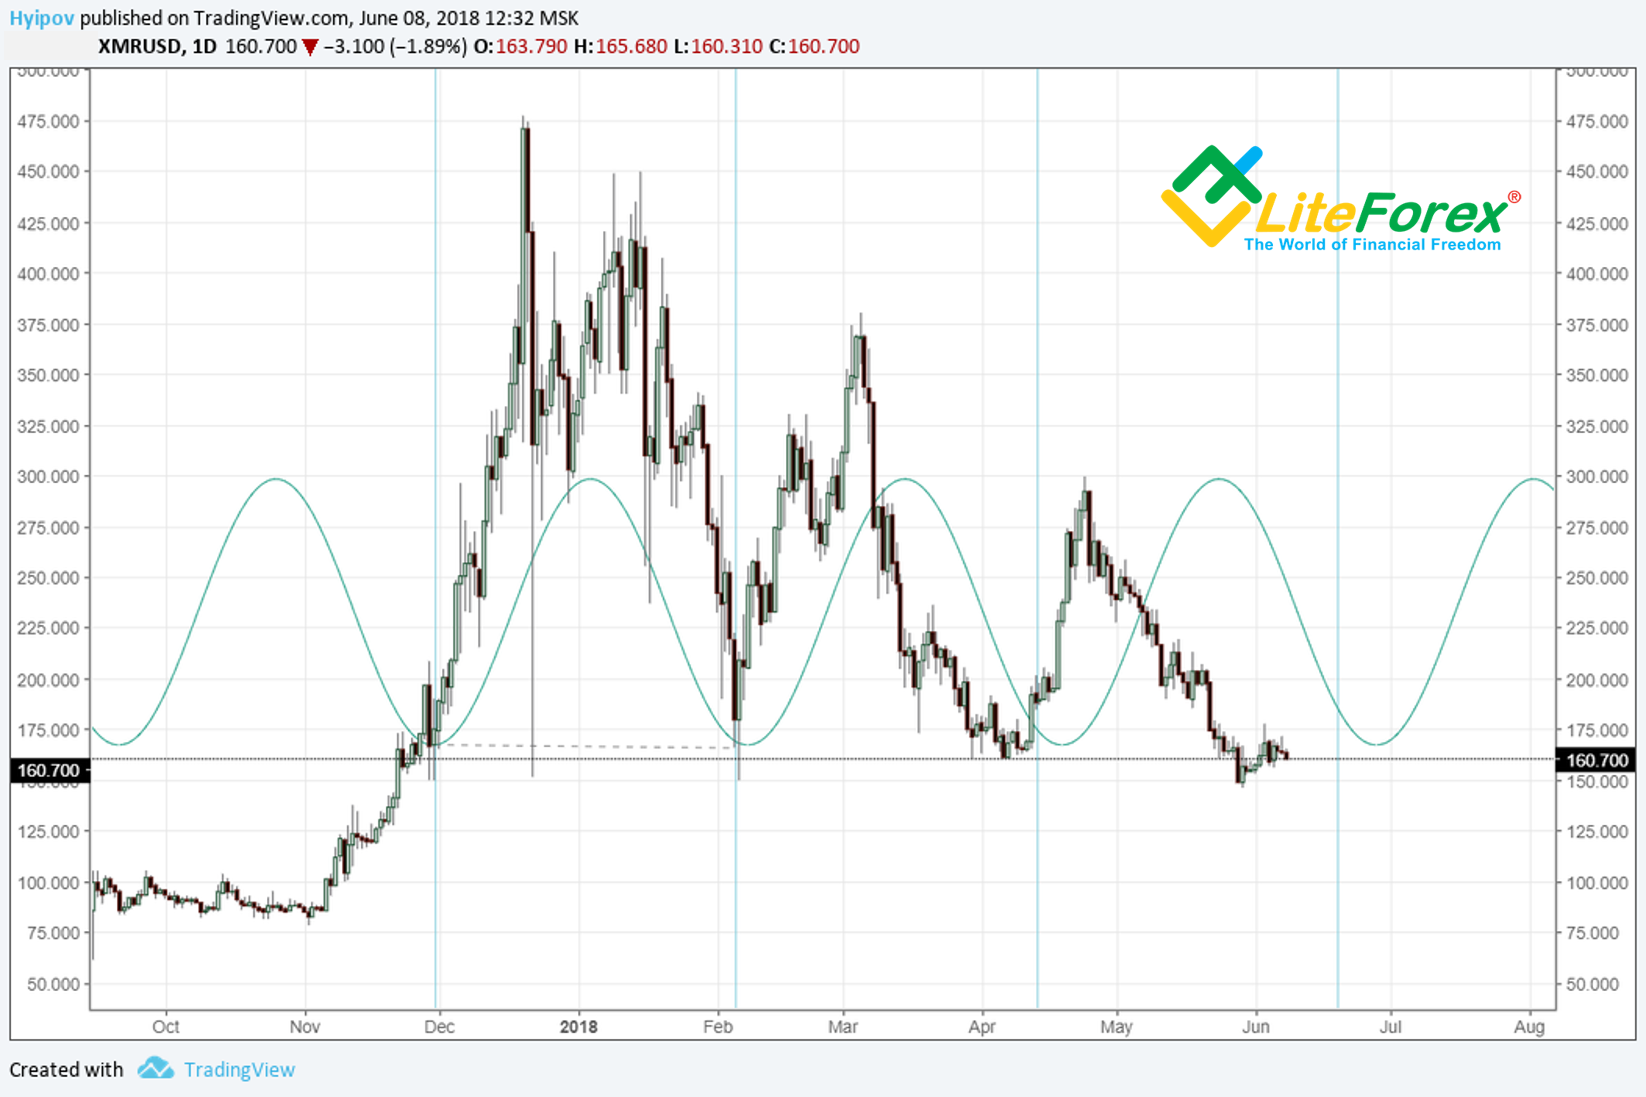
In the chart above, I analyze cycles. As it is clear, XMR/USD is moving in the given direction with the same frequency. According to the theory of cycles, the cycle can change; and we see it right now. According to this regularity, there should be another growth cycle of the XMR/USD pair.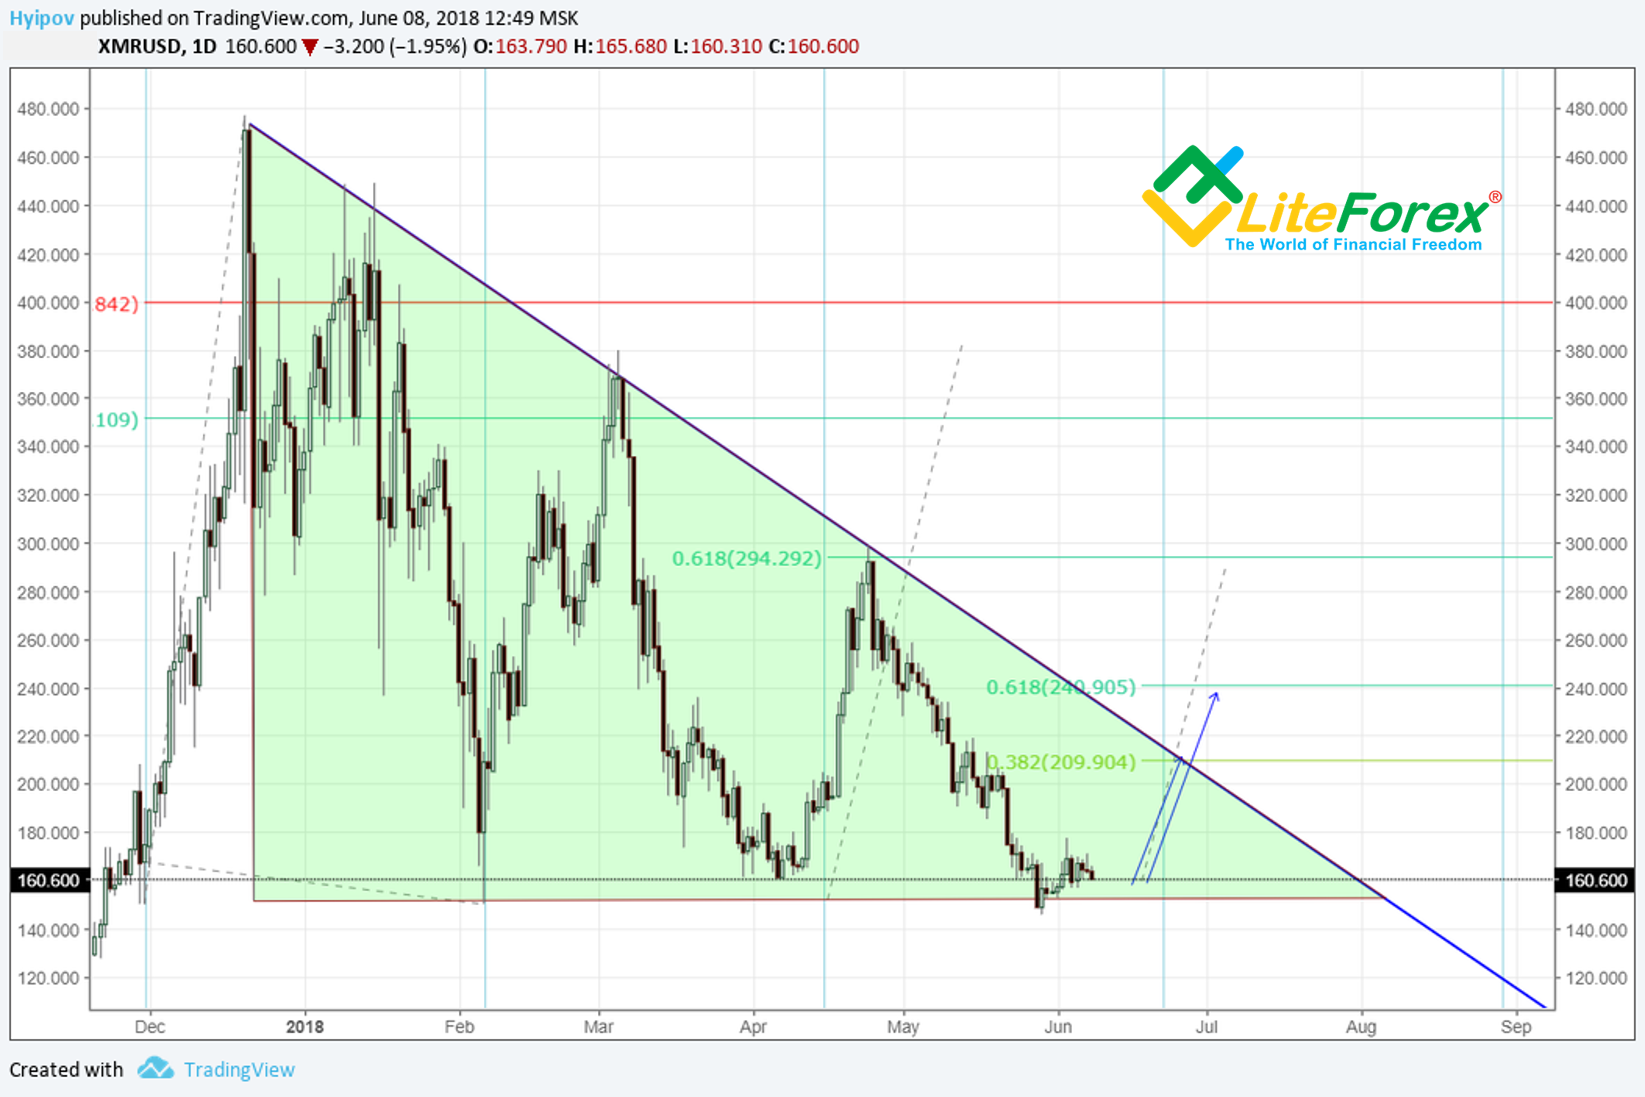
In the chart above, you see that the highest peaks of each momentum are not above than 0.618 from the previous cycle height. Based on this, the future momentum has two strong resistance levels. One is around the triangle’s upper leg (about 209 USD), another is around 0.618 Fibo from the last cycle, at about 240 USD.
Summary
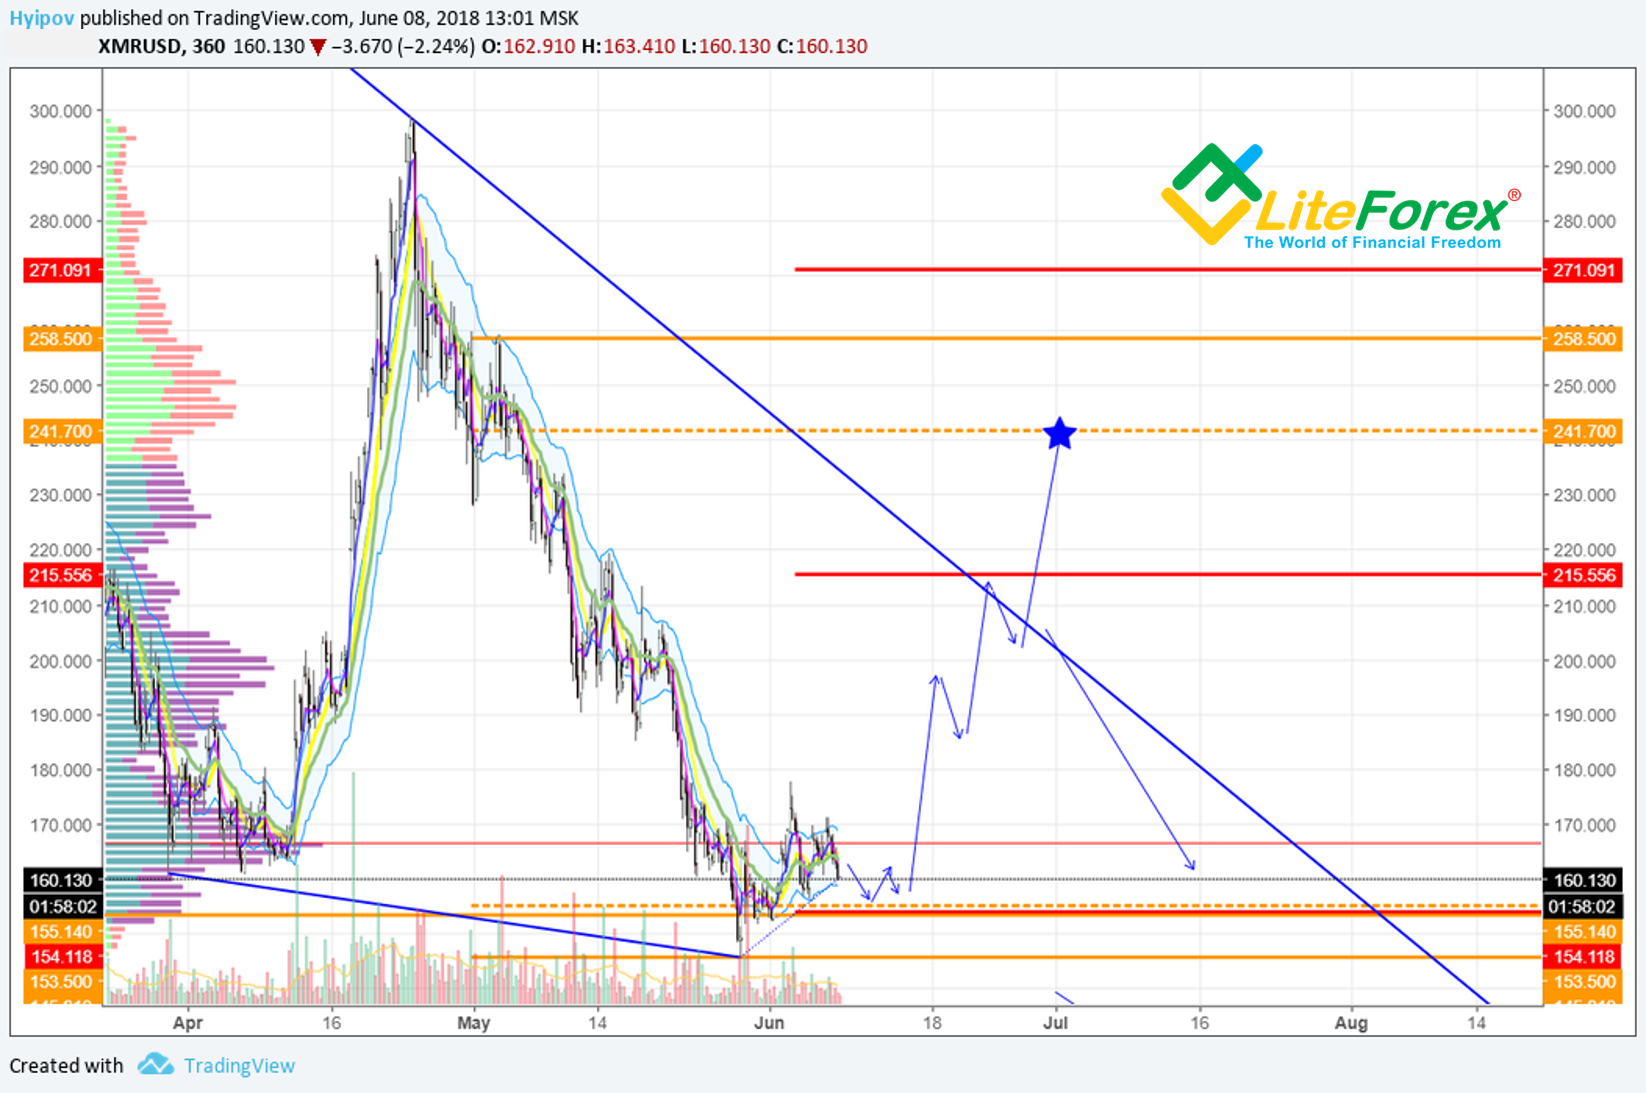
Summing up all the above, we can expect the accumulation at the current levels to continue next week (or earlier). Next, the ticker is likely to try to go up and to start the new cycle.
The first upward target is around 210 USD (resistance of the triangle’s upper leg, 0.382 Fibo from the last cycle and Keltner channel’s moving average).
If these levels are broken out, the provoking momentum will emerge, which means the triangle’s breakout. This moment is very good for manipulators, as they can safely fix their longs and go short. In this case, the highest growth peak I expect at 240 USD (the level of May candle’s close and 0.618 Fibo from the last cycle length.
At the same time, you must understand that the support zone between 145-155 USD is very clear, and the manipulators know that there is a whole army of buyers in the zone, which is rather attractive.
So, we can’t rule out this scenario: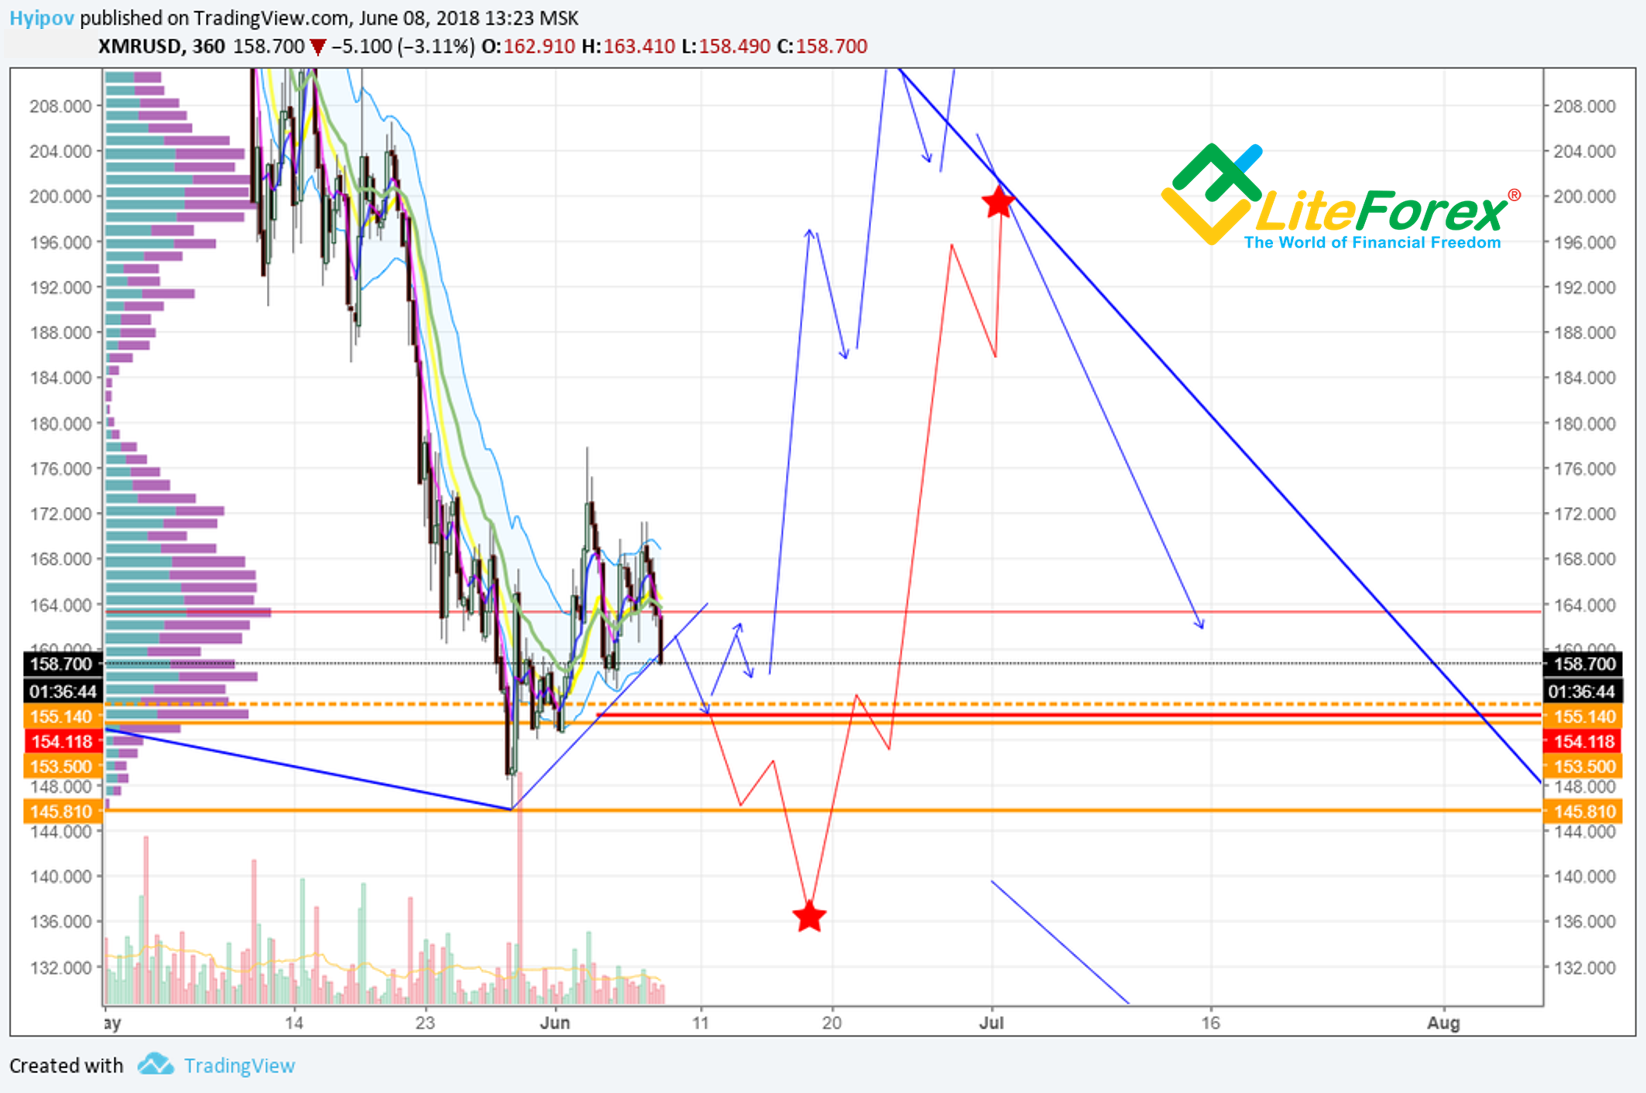
Manipulators may trigger stop losses at 140 USD. This breakout will be a signal for everybody to go short, so that the whales can easily stock up on the sales and have enough resources to drive the price up to the top check points. (I marked this scenario with the red line).
As you see, both the first and the second scenarios suggest the common key level at 155 USD. The future scenarios will depend on where the market moves from this level.
I wish you good luck and good profits!
