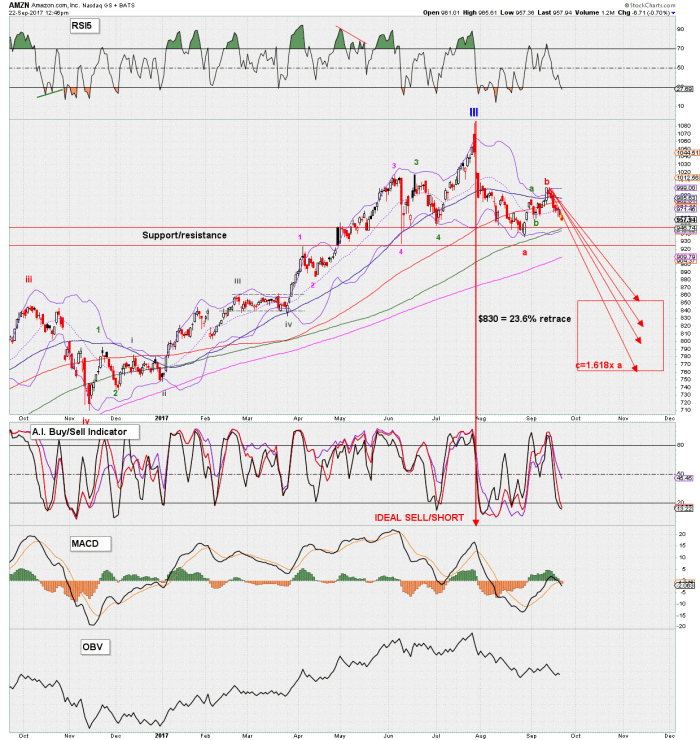
Amazon.com Inc (NASDAQ:AMZN) has been Wall Street’s and every Traders wet dream for a long time. But, as we all know, all good things come to an end and we all need to wake up one day. On the day of its latest earnings release, AMZN spiked to an intra-day high of $1080+ only to end the next two days down to $980. A $100/share drop. Ouch. This drop usher in an ideal sell/short signal on my A.I. indicator, which is price, time and momentum based. See red down arrow in the daily chart below.

The Elliot wave count on the chart suggest primary III of Cylce-1 has topped. This means price should now be in Primary-IV and once this correction has completed, Primary-V will take price to new highs, before C2 (a much larger correction) sets in.
So where will Primary IV bottom? The daily chart shows the ideal target zone, based on the assumption that the recent high at ~$1000 was intermediate-b of major-a of Primary-IV. The 100 to 161.8% Fib-extensions then target between between $850-$760 for all of major-a. That’s quite the range, but we do know that the 23.6% retrace of the entire primary III wave is at $830, which is right in our target zone.
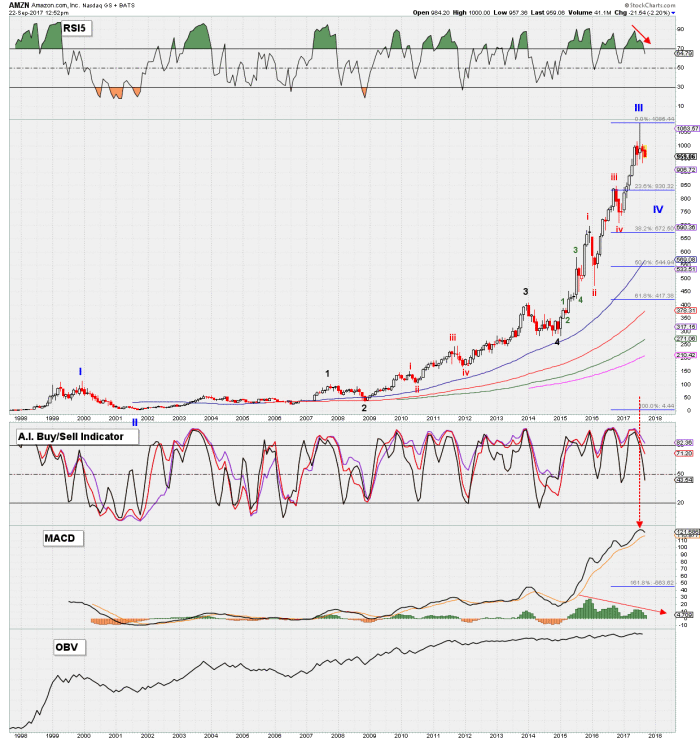
The monthly chart below shows the big-picture count and retrace levels even better. We can also see that at around $830, price made a prior high. Thus resistance may now act as support. Please also note the negative divergence on the monthly RSI5 and MACD-histogram, as well as an A.I. sell signal.

In addition, 4th waves often retrace between 23.6% and 38.2% of the prior entire length of the 3rd wave, and if the latter retrace level is the end-goal, then the 23.6% retrace level is the a-wave target of an a-b-c decline. So far so good.
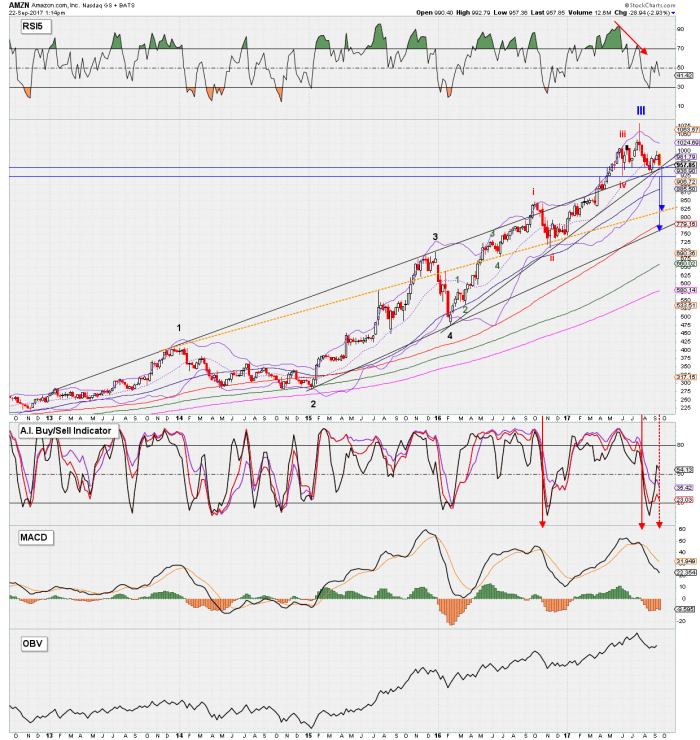
The last chart I wanted to share is the weekly chart. Also here we can count the same waves up, confirming the Elliot wave counts on the daily and monthly time frames. Also here we have negative divergence, and sell signals galore. The current support levels are shown by the blue horizontal lines and using simple symmetry breakdown levels we see that a break below $951 to $941 targets $825 to $760ish. The former is right on the money given the price targets derived from the daily and monthly charts.

The breaks below $951 to $941 will also coincide with a break below the long term (black) uptrend lines and targets the intermediate-term dotted orange uptrend line.
Hence, for now I am looking for $830s to complete major-a of Primary-IV. Then a larger bounce for major-b, which I can’t foretell how high it will go. But once, key levels of that larger bounce are broken I expect price to drop to around the 38.2% retrace level: $700s, which is very strong support.
Disclaimer: I am short AMZN
