Get 40% Off
These stocks are up over 10% post earnings. Did you spot the buying opportunity? Our AI did.Read how

All Things Being Equal

Published 04/13/2021, 02:00 AM
Updated 07/09/2023, 06:31 AM

The ghost of 2013 indeed is hanging over this market. Nothing matters and the trend remains fully intact and new record market highs are made every month. November, December, January, February, March, and now April as any smaller pullbacks are continuously bought. Steady and guaranteed gains every month as markets continue to drown in liquidity and recovery optimism.

As such markets continue on their path of record disconnects of asset prices from the economy reaching over 201% vs GDP now:
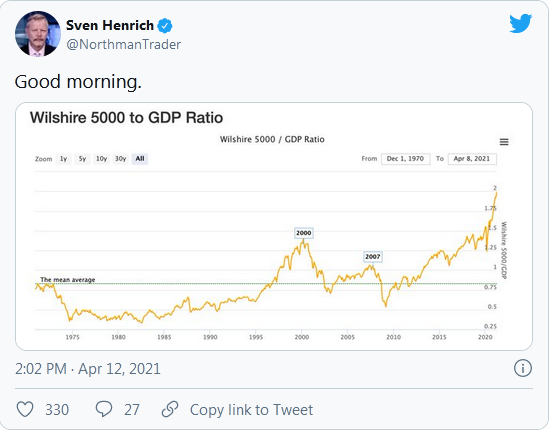
Wilshire 5000 To GDP Ratio Chart

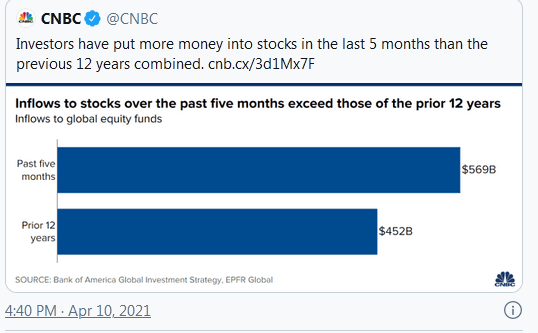
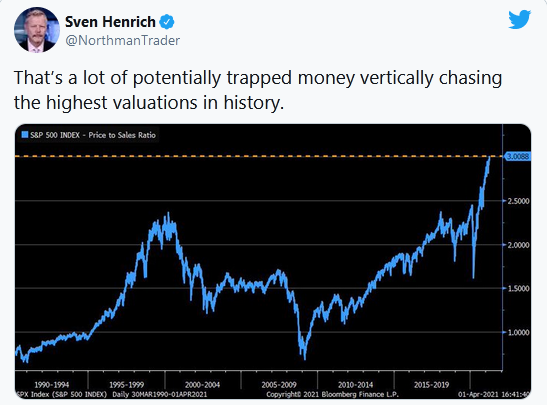
As with any bubble valuation metrics are disregarded and new narratives spring up to justify the price action and previous metrics are discarded as irrelevant. This process will work until it doesn’t and frankly it has to because equity inflows have taken on epic proportions with people piling into the highest valuations in history
S&P 500 Index - Price To Sales Ratio

CNBC Tweet

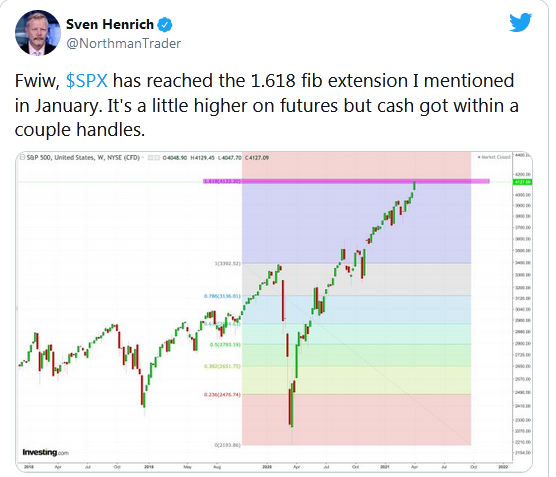
Which brings us to an interesting technical area in the price action:

S&P 500 Weekly Chart

Tweet

This was a technical price zone outlined as a technical risk/magnet in January of 2021. Now, like most Wall Street analysts, this was a view of what could happen by year end, but $SPX in April has already blown out the year end price targets for most Wall Street analysts. There are higher price targets out there into 4500 and I’ve outlined a technical view of that possibility as well.

But reaching this 1.618 fib extension so early in the year says something.

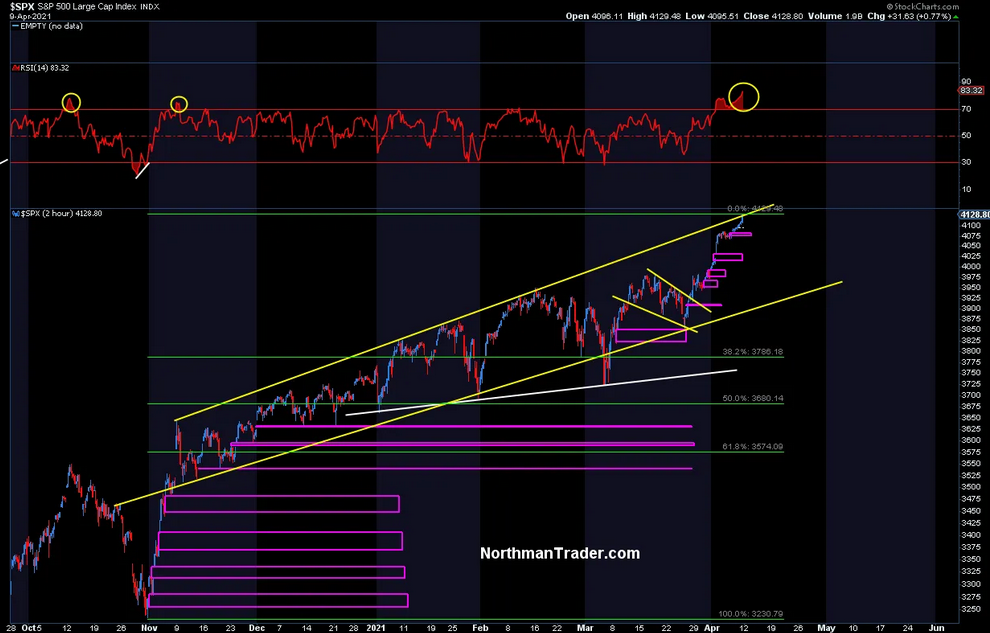
In the short term: SPY is again acting like it’s September 2020:
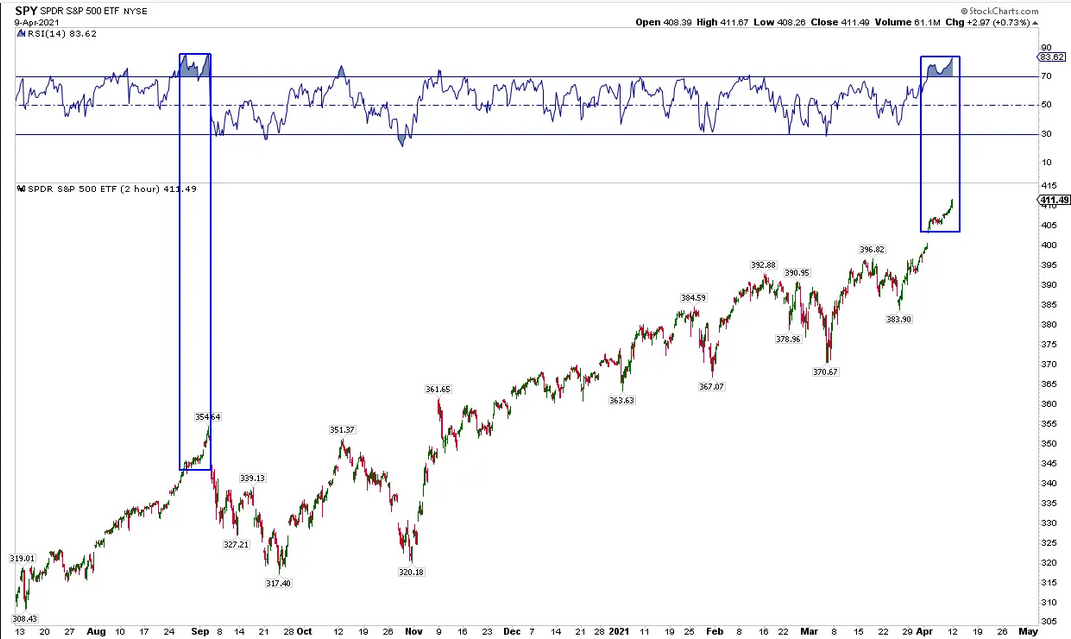
S&P 500 ETF 2-Hr Chart

Overbought, stretched, vertical, with gains based on many unfilled overnight gaps beneath:
3rd party Ad. Not an offer or recommendation by Investing.com. See disclosure here or remove ads .

SPX 2-Hr Chart

Back in September 2020 this type of action resulted in a 10.5% correction. Whether we will see something similar or worse at some point this month or next remains to be seen, but all things being equal one can now observe something we haven’t seen since February 2020. A divergence of equal weight:
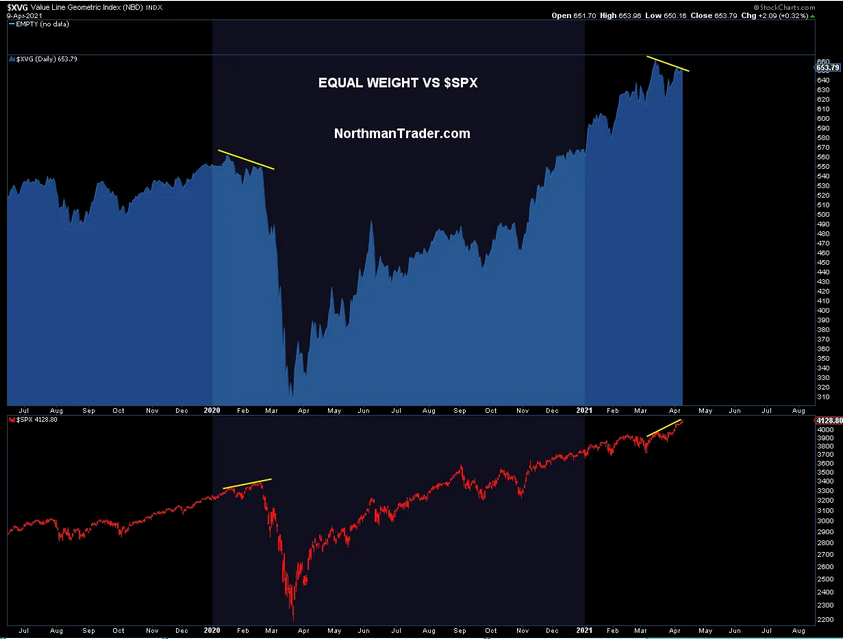
XVG Daily Chart

Note that as earnings season is upon us (and earnings reports will not only speak to results but also outlooks which will shed light on the reality of ramping inflation and rising cost structures) small caps are suddenly lagging:
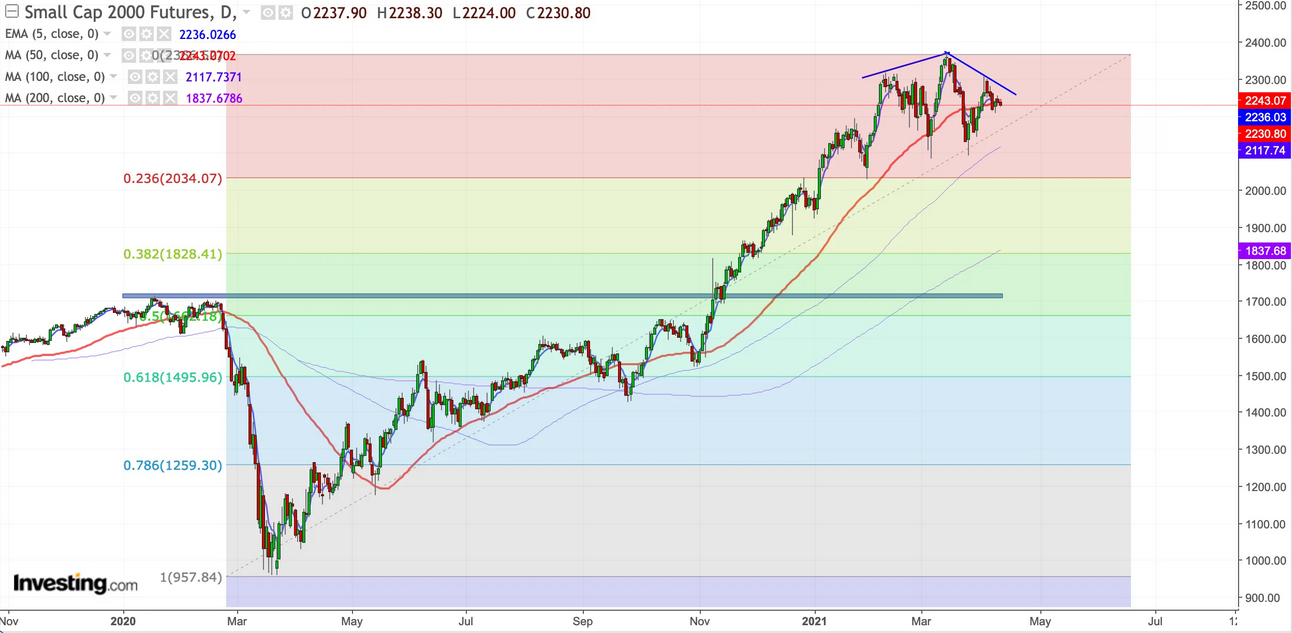
Small Cap 2000 Futures Daily Chart

So this steady as she goes non stop melt up is exhibiting some signs that something is afoot right as markets are reaching a key technical zone. My view remains: This market has an appointment with many open gaps to fill to the downside. On SPX as well as on VIX, hence, in my view, it’s important to know where these levels are as they may represent actionable pivot points to come.

Original Post

Latest comments

I'm also waiting for the gaps to fill. Thanks for your excellent service!
Risk Disclosure: Trading in financial instruments and/or cryptocurrencies involves high risks including the risk of losing some, or all, of your investment amount, and may not be suitable for all investors. Prices of cryptocurrencies are extremely volatile and may be affected by external factors such as financial, regulatory or political events. Trading on margin increases the financial risks.
Before deciding to trade in financial instrument or cryptocurrencies you should be fully informed of the risks and costs associated with trading the financial markets, carefully consider your investment objectives, level of experience, and risk appetite, and seek professional advice where needed.
Fusion Media would like to remind you that the data contained in this website is not necessarily real-time nor accurate. The data and prices on the website are not necessarily provided by any market or exchange, but may be provided by market makers, and so prices may not be accurate and may differ from the actual price at any given market, meaning prices are indicative and not appropriate for trading purposes. Fusion Media and any provider of the data contained in this website will not accept liability for any loss or damage as a result of your trading, or your reliance on the information contained within this website.
It is prohibited to use, store, reproduce, display, modify, transmit or distribute the data contained in this website without the explicit prior written permission of Fusion Media and/or the data provider. All intellectual property rights are reserved by the providers and/or the exchange providing the data contained in this website.
Fusion Media may be compensated by the advertisers that appear on the website, based on your interaction with the advertisements or advertisers.
© 2007-2024 - Fusion Media Limited. All Rights Reserved.