I’m titling this 2021: The Alternative View simply because Wall Street consensus is again entirely bullish for 2021 driven by the presumed view of a strong economic recovery to come along with continued aggressive central bank intervention. Fair enough and let’s assume this to be the base case.
In fact let’s just get the bullish case out of the way to start with.
Since most seem to be projecting $SPX north of 4,000 I’ll offer a technical chart that suggests a move toward $SPX 4000 or beyond is technically possible if nothing matters and that’s a basic fib extension of the current move:
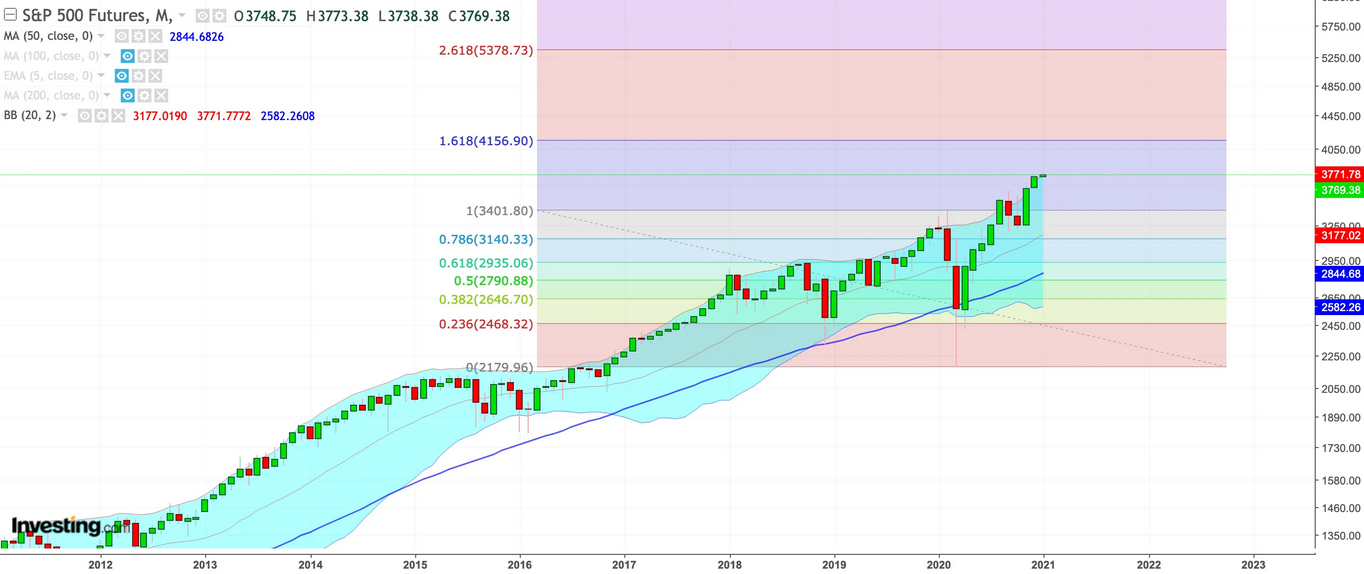
That’s 4156, the 1.618 fib. That’s the technical upside risk that presumes record valuations and the farthest disconnect from equity valuations and the economy doesn’t matter. Let’s not forget that markets closed 2020 at 186% market cap to GDP an all time history high. Typically one does not start a recovery with all time bubble valuations. But hey.
That’s what Wall Street presumes and projects. I however want to at least offer a varying perspective, especially in context of the big macro video (The Ugly Truth) I had put out this weekend. It’s long I know, but if you haven’t seen it I’d encourage you to watch it when you have time as it offers a big in depth view of the larger state of affairs:
One of the points I make in the video is that all projections by everybody have been wrong in the past few years and liquidity has been really the only key deciding factor:
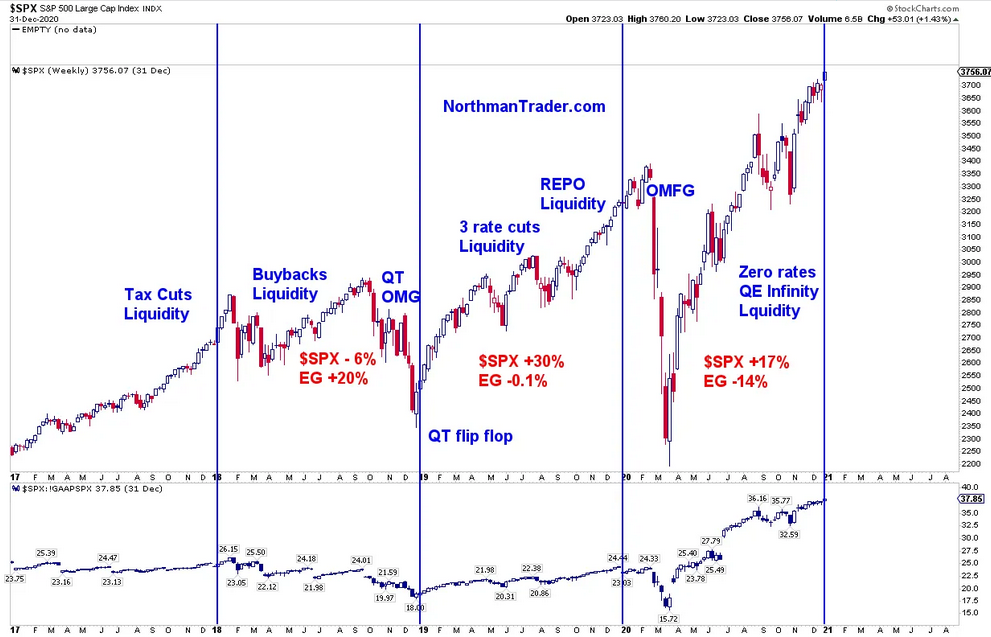
At the end of 2017 Wall Street predicted tax cuts would result in expanding economic growth to produce higher asset prices, instead we got little new growth but buyback fueled earnings growth yet lower asset prices due to the Fed tightening. For 2019 Wall Street predicted earnings growth and higher yields but none materialized yet asset prices flew higher anyways on the heels of 3 rate cuts and the Fed’s repo operations and related balance sheet expansion of several hundred billion dollars.
In 2020 Wall Street came out with higher $SPX price targets again with the view of again further expanding earnings growth. For reference these were the most aggressive $SPX targets outlined in December 2019 for 2020 presuming positive earnings growth:
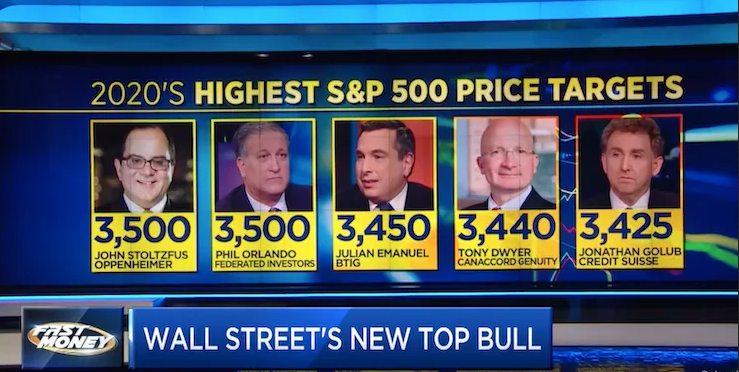
Instead $SPX closed 2020 at 3755, much higher than even the most aggressive price targets, but not on positive earnings growth, but rather on -14% earnings growth. Ha ha. Joke on everybody. Where we’re going we don’t need earnings growth. I jest but the message is clear: Everything is disjointed and disconnected.
Fact is predictive efforts to use earnings growth as a justification for higher asset prices have become a mockery as during the past 3 years price moves have been completely detached from developments in earnings growth. Fact is in the past 2 years $SPX has gained over 50% on aggregate negative earnings growth (a temporary 35% crash in early 2020 notwithstanding).
Like it or not the market action is entirely driven and distorted by one key factor:

And what is needed for markets to continue to rally? One factor alone:
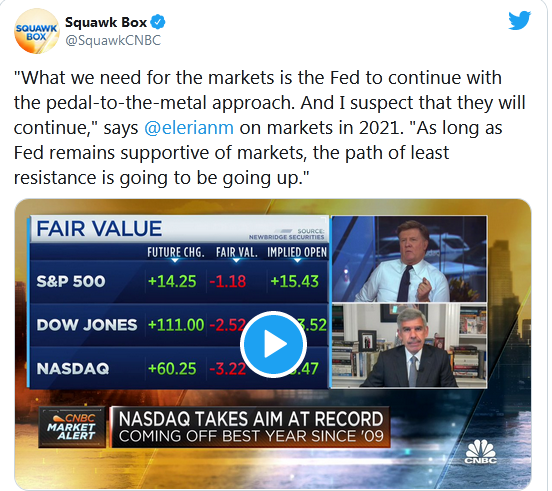
So can we please stop with the facade of using earnings growth to justify higher price targets?
As it stands Wall Street presumes positive earnings growth for 2021 to the tune of +22% (which is possible) and again even higher price targets based on continued efficacy of central banks to maintain and/or expand the historic disconnect between asset prices and the economy.
Given this backdrop I wanted to offer a few select technical charts that leave room for an alternative path to 2021.
Before I do that a simple observation: In 2020 markets indeed rallied right through year end, this was the melt up scenario I outlined in Greed is Back at the beginning of December based on the 1999/2000 $NDX scenario:
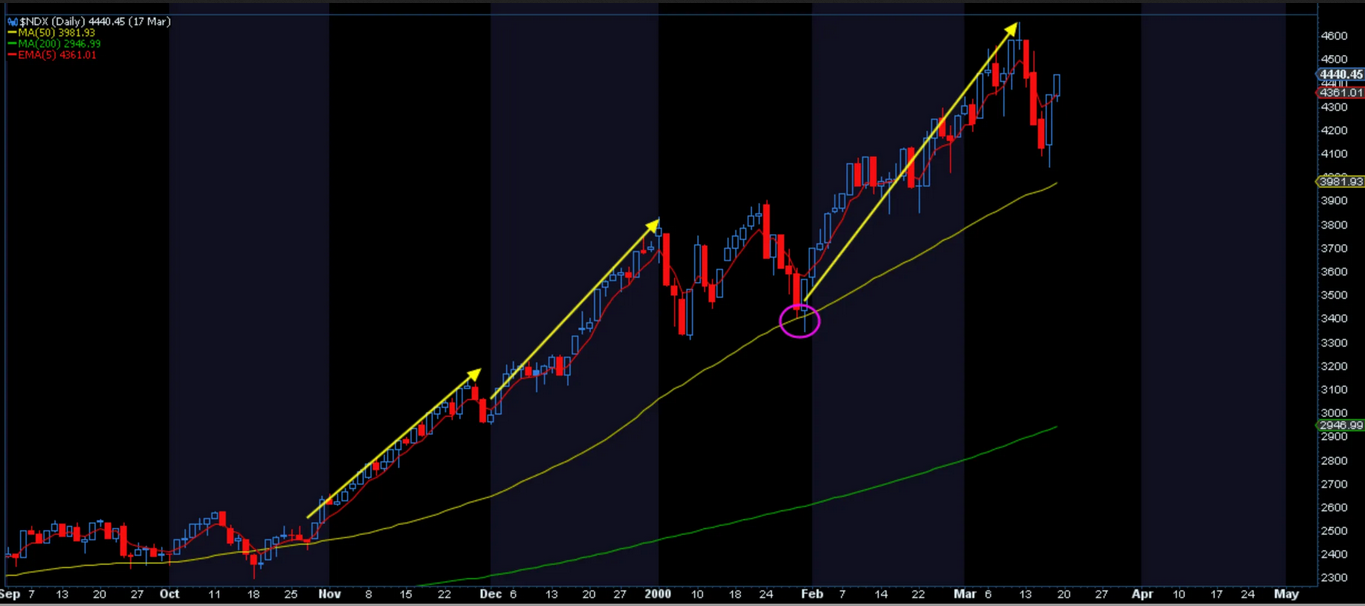
In December I also suggested selling to occur in early January: “The chart shows a sizable decline in early January. Why? Tax loss selling. When people have a lot of gains in stocks they typically don’t want to sell until the next tax year.”
Indeed we can observe similar behavior so far on this first trading day of January:
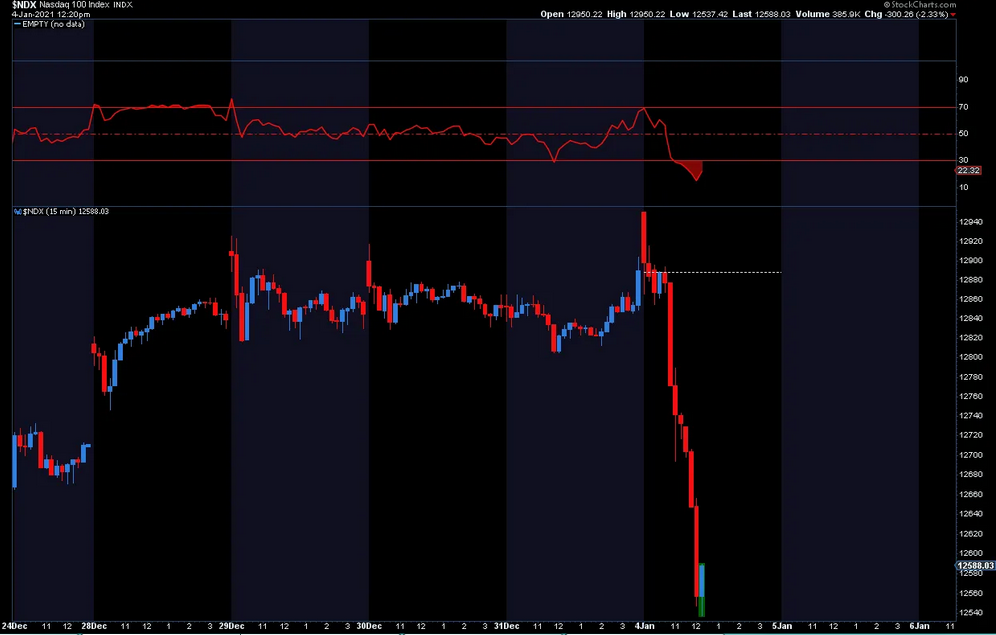
So from this perspective early year weakness could well set up for buying opportunities for either lower highs or new highs yet to come. Indeed late year price jam ups can well translate into more strength at the beginning of the following year.
After all in 2000 markets didn’t peak until March, in 2020 we didn’t top out until Feb. 19 before the crash. In 2018 we didn’t top out until Jan. 29.
But there are some key differences to previous years and they inform the potential for the alternative view.
For example, this year we’re entering the year with the highest MA disconnects ever in many index charts:
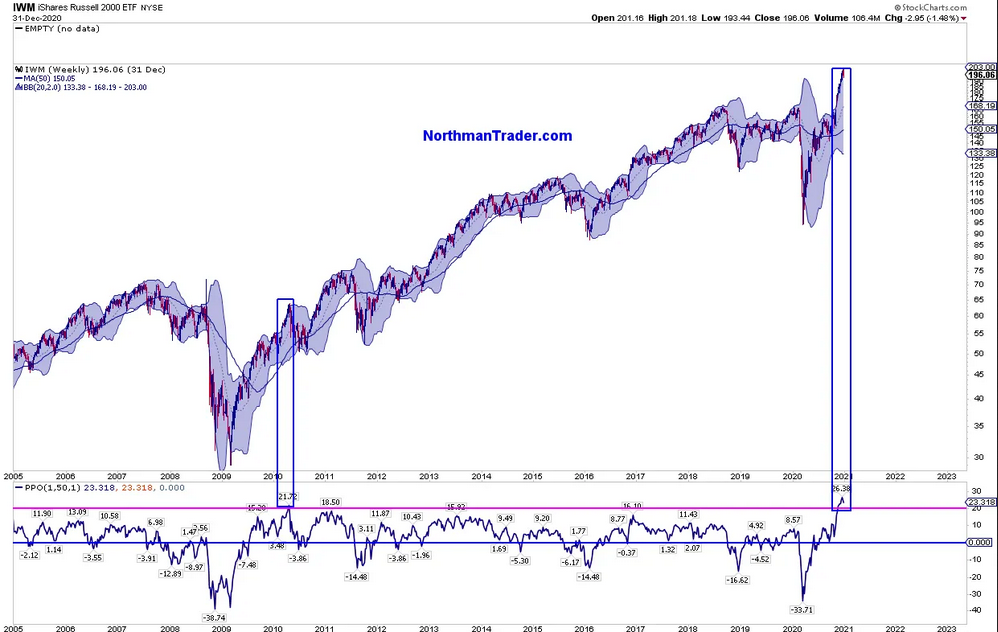
There is no history of such MA disconnects to be sustainable and in my view 2021 will see key MA reconnects at some stage. Whether these will then posit buying opportunities or will be signs of a breaking bull market will have to be assessed then.
We’re also seeing a market with most open gaps ever, example $NYSE:
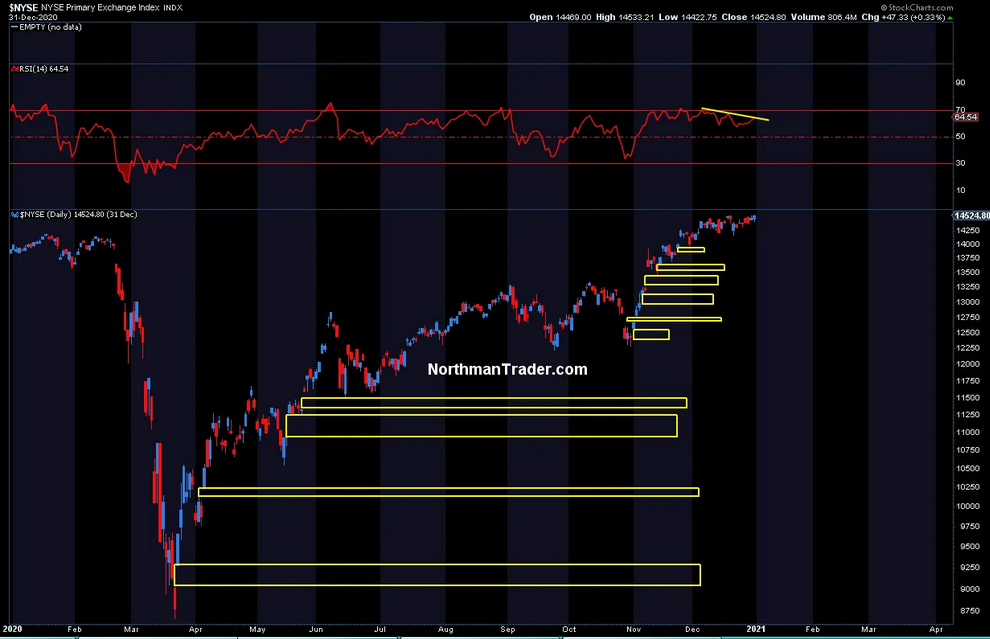
Never has been a rally sustained with so many open gaps below. I expect major gap filling action at some stage in 2021. Not all gaps may get filled, but initially the entire gap action from the November rally may get filled at some point and that too may set up for a buying opportunity.
Of larger concern for bulls however:
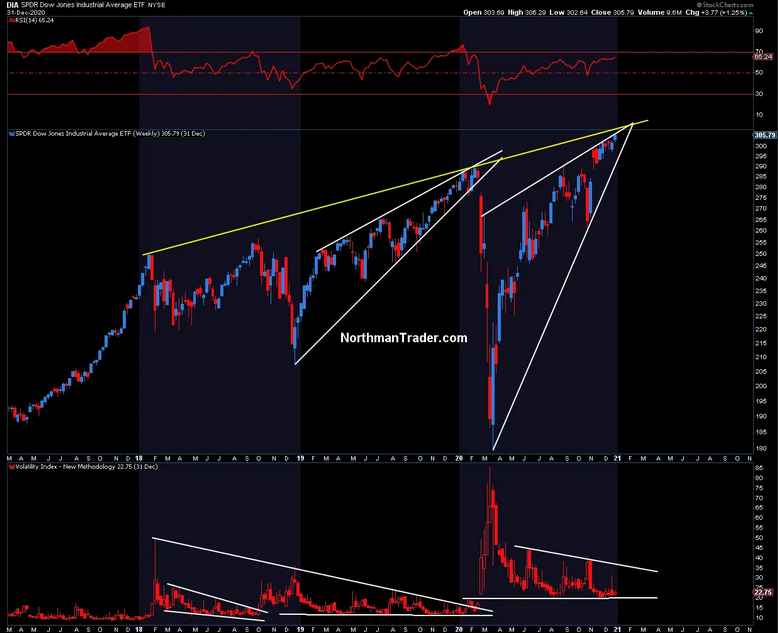
What if all the price advances in 2020 came in context of another round of larger bearish rising wedges rising into key resistance?
See the $DJIA:
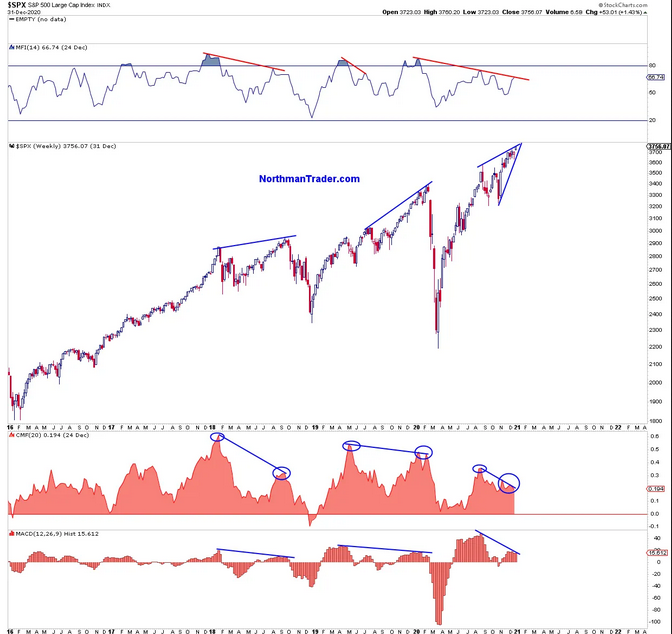
See $SPX, also in context of massive negative divergences in money flows previously outlined in Mystery:
Indeed see this much larger wedge on $ES:
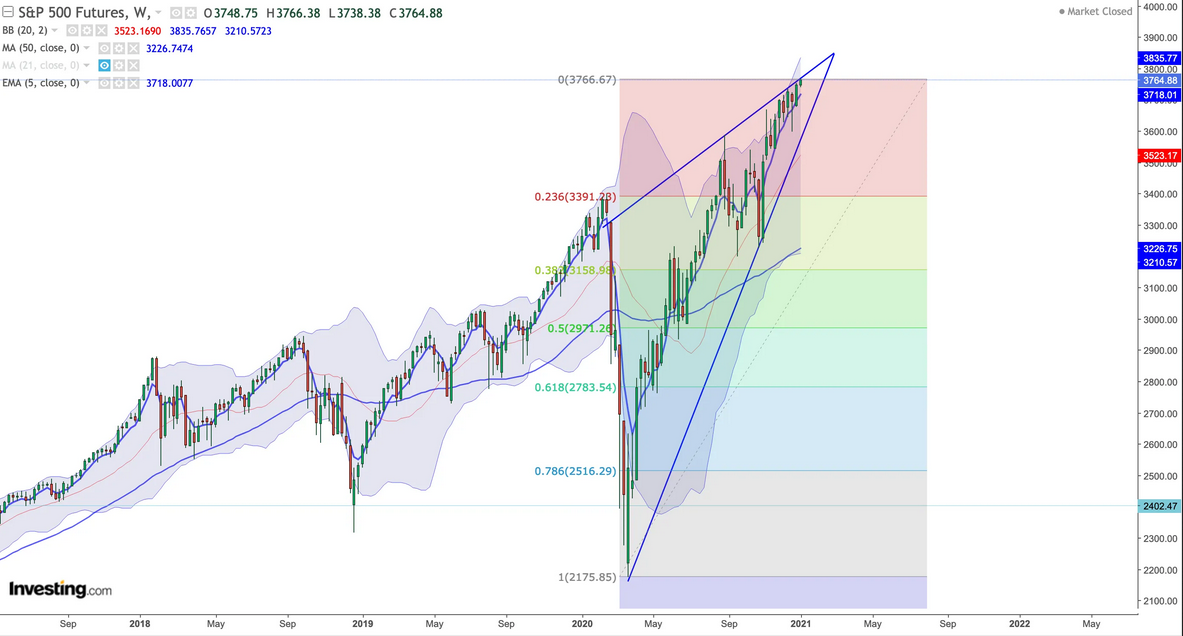
These larger patterns, as long as not invalidated, have potential for higher prices still, but should they technically break they leave the possibility for massive downside in equities, especially on context of a market trading at 186% market cap to GDP.
In addition to these wedge patterns note the corollary structure in the US dollar. Much of the rally in 2020 has been dependent on a declining dollar and this trend has continued even into early 2021 but note the pattern is similarly bullish dollar as it was in 2018:
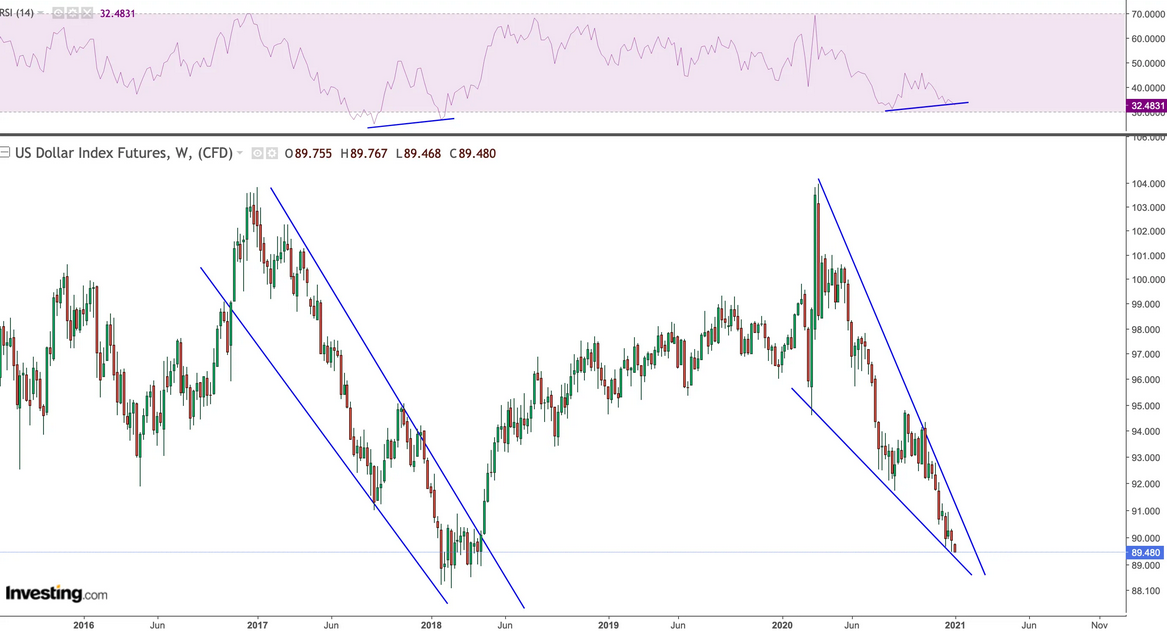
All of these charts suggest a completely bearish outcome to 2021 is at least a possibility with massive volatility to come at some point:
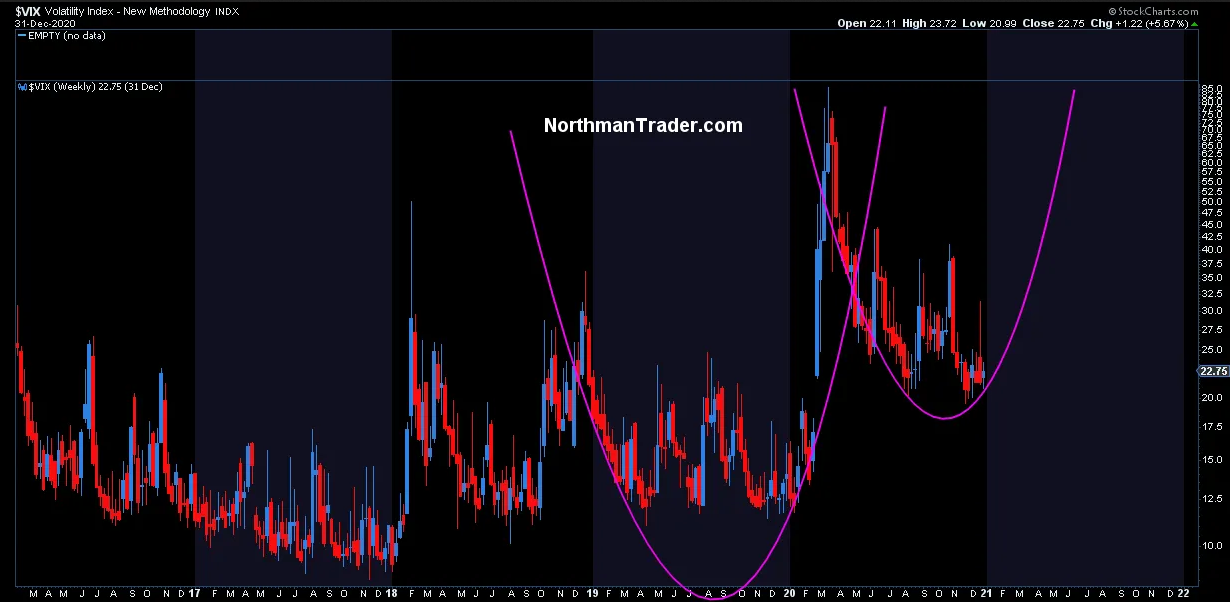
Indeed one of the biggest unspoken mysteries of 2020 has been the inability of the $VIX to fill its February 2020 gap despite trillions in interventions, vaccines introduced and new record market highs with many days seeing the price action dominated by price gaps with little intra-day volatility.
Not to scare anybody here, but this larger $VIX structure is of a potential cup & handle pattern and as long as it’s not invalidated, it has the potential for $VIX 130. Yes you are reading right. Ridiculous? So was my wife’s $VIX 90 call in the fall of 2019 when $VIX was trading in the low teens (see the Big Short):
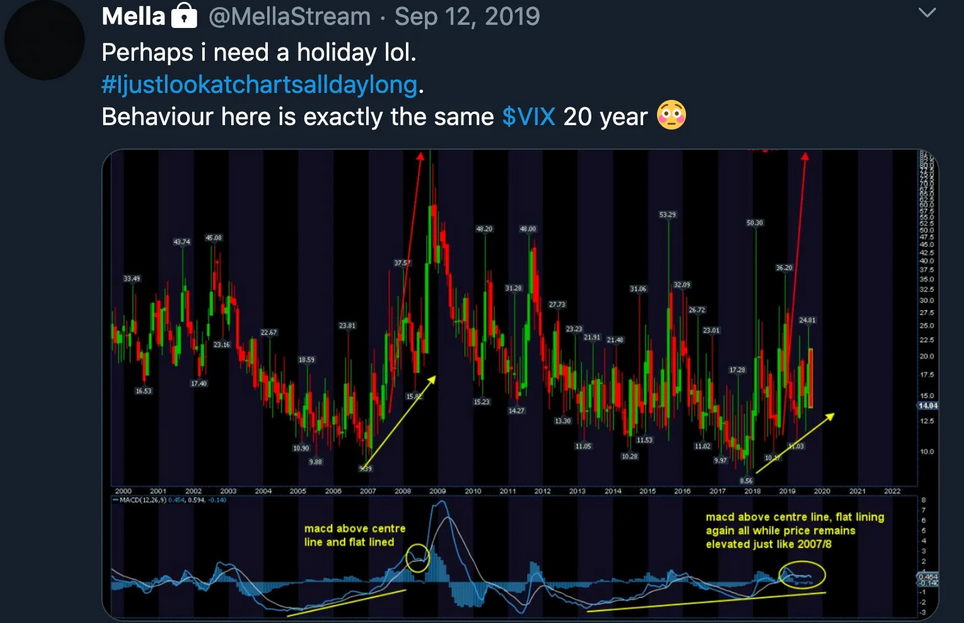
But it happened.
And hey Robinhooders, anybody remember $VIX 172? Oh yea that happened once too in a market far far away:
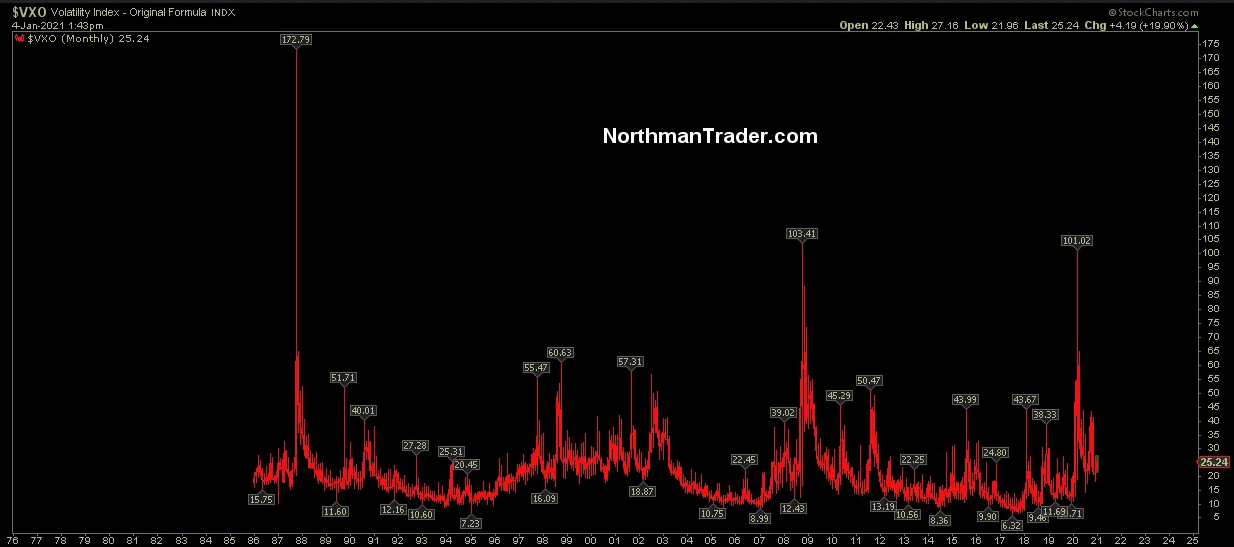
The $VIX was called $VXO then, but it’s still trading today.
Nobody is saying $VIX 130 tomorrow or next week and it may never happen. These are big structural charts and they could take months to play out, but they all suggest potential massive risk to the current uniform bullish narrative.
In context everybody seems to have forgotten about the yield curve:
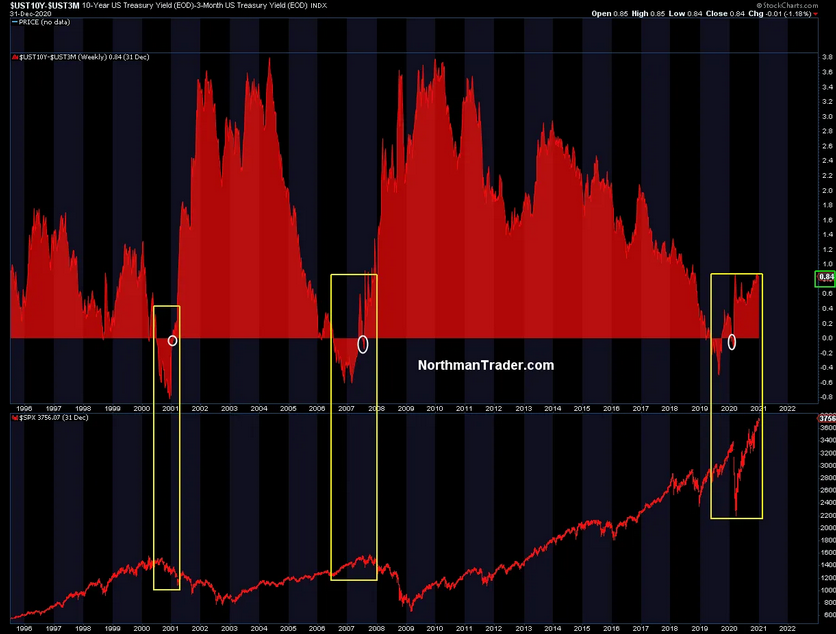
We had the initial inversion which everybody ignored, then the recession and now the steepening. And typically a steepening of the yield curve brings about much lower asset prices.
What if 2020 was all a liquidity mirage, a perversion of the market cycle and this cycle is to now assert itself and bring about a process of rebalancing and price discovery made worse by the artificial price extensions brought about by central bank overindulgence in intervention?
A rhetorical question. For now.
Final thought: We live in this fantasy world of permanent asset price inflation:
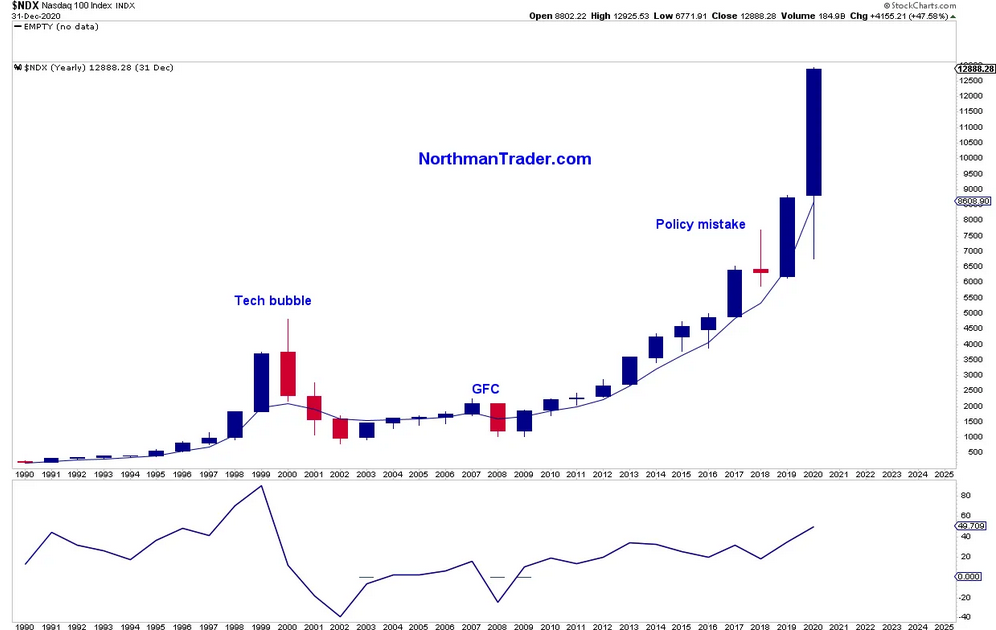
$NDX closed the year 2020 49% above it yearly 5 EMA. That’s ridiculous, only surpassed by the tech bubble in 2000 and it suggests major reversion risk in 2021 for yearly 5 EMA reconnects some stage.
Bottomline: These are historic times and we’re witnessing artificial market influences the likes we have never seen before. 2021 will be very much about a reconciliation of historic never before seen valuations, an unfalsifiable belief in a strong recovery and continued central bank efficacy versus technical disconnects and structural patterns that leave room for the alternative view.
This reconciliation process will take months to sort itself out and will offer astute and flexible traders plenty of opportunities to partake in large price ranges to the upside as well as to the downside. Indeed we may see a blow-off top first in the early part of the year followed by a complete reversal in the second half. Or perhaps markets already topped. Or nothing happens and central banks remain in control and the magic asset price inflation fairy will continue to sprinkle multiple expansion dust on this market.
I can’t tell you how the year 2021 will turn out nor will I pretend to throw out price targets, rather I want to suggest humility in face of the reality that everybody has been wrong about their earnings growth, economic growth and yield forecasts over the past 3 years. Yes, central banks have been able to bail out bad forecasts yet again. But that lack of predictive ability by the entire spectrum of Wall Street and central banks should give everyone pause or it at least suggests to keep a watchful eye on some of the charts I outlined above for these charts may offer important guideposts as the year progresses.
