
Narratives in Financial Markets
The USD continues to trade on the back foot as reports emerge that U.S. trade negotiators aim to target a more stable yuan as part of the comprehensive trade deal being negotiated. A firmer yuan is a risk positive event for the likes of EM (emerging markets) and beta currencies (AUD).
Renewed hopes of a benign Brexit resolution kept the GBP well bid across the board. Tuesday’s GBP spike appears to have been triggered by headlines from a government minister (Harrington) stating that if May cannot pass a deal, then the parliament will take control, adding a no-deal Brexit not envisioned. U.K. PM May is scheduled to meet EC President Juncker on Wednesday, so be prepared for further headlines with intraday spikes in vol.
U.S. equities ended building on top of its recent gains with an upbeat earnings report by the retail giant Walmart (NYSE:WMT) re-igniting the ebullient mood from the open of business in NY. On the contrary, European equities ended mostly lower as the threat of car tariffs by the U.S. persists.
Fed’s Mester went on a feast of headlines, of which the admission that the Fed should announce balance sheet plans well in advance was the most relevant, further adding she doesn’t see the need to taper the balance sheet runoff before halting it (risk positive).
Germany’s February ZEW survey current situation remains on a continuous slump, falling to 15.00 vs 20.00 expected, marking the lowest reading since December 2014. The ZEW institute sounded quite cautious, noting they don’t expect a ‘rapid recovery’ of the weakening trend.
BoJ’s uber-dovish Mr. Kuroda said the Central Bank will mull further easing if deemed necessary in cases such as perception of slowing economy or weaker price trends.
Out of the recent RBA minutes, the key takeaway was the uncertainty surrounding household consumption as the housing crisis continues. The board continues to sound fairly vague and non-committal on the next rate direction, even if the tone has been skewed towards the dovish side. In the minutes, they noted the RBA ‘saw scenarios for hikes or lower rates’.
U.K. wage inflation keeps growing at the fastest pace in a decade while employment figures remain strong with a jobless rate of 4%, which is the lowest since 1970.
RORO — Risk On Risk Off Conditions
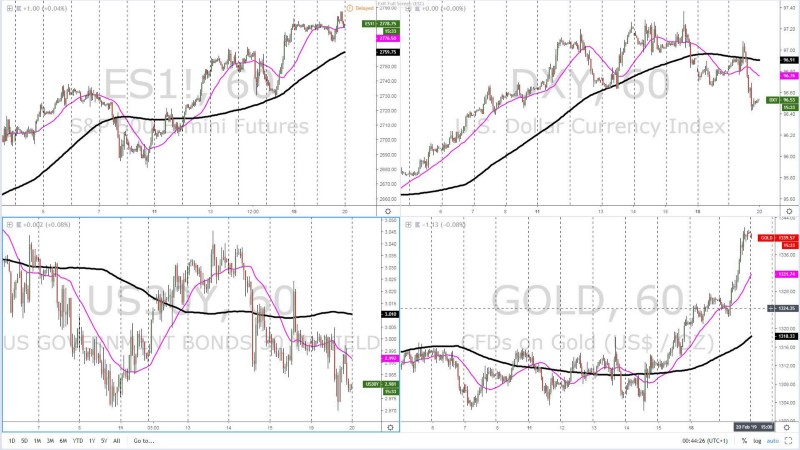
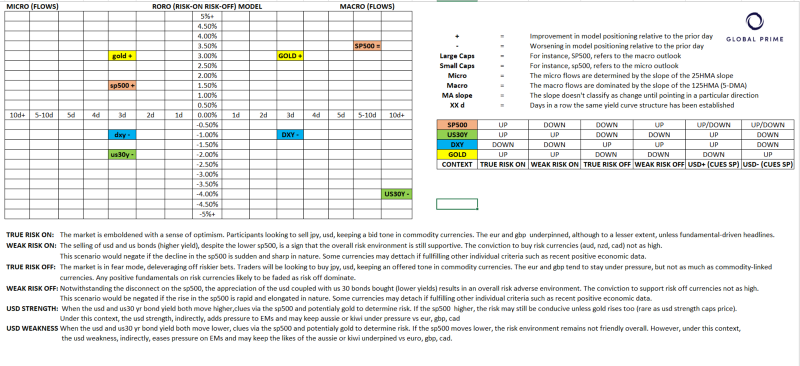
A familiar theme continues to pan out in financial markets. By looking at the charts, and represented in the table above, we can clearly see how the environment remains aggressively USD negative. The next wave of selling has finally produced an inflection point in the macro flows as depicted by the downward slope in the 125-HMA (5-DMA). From a market structure standpoint, the selling in the DXY has opened up further downside after achieving a successful rotation lower.
The USD weakness is also manifested via lower U.S. yields and a much higher Gold, closing at nearly $1,340.00. As part of this excess of USD supply, U.S. equities keep pushing higher, which is obviously helping the likes of the beta currencies such as the Aussie, the Kiwi, the Loonie. As part of this context, even the euro or the pound have also made significant gains following the strength in the Chinese yuan.
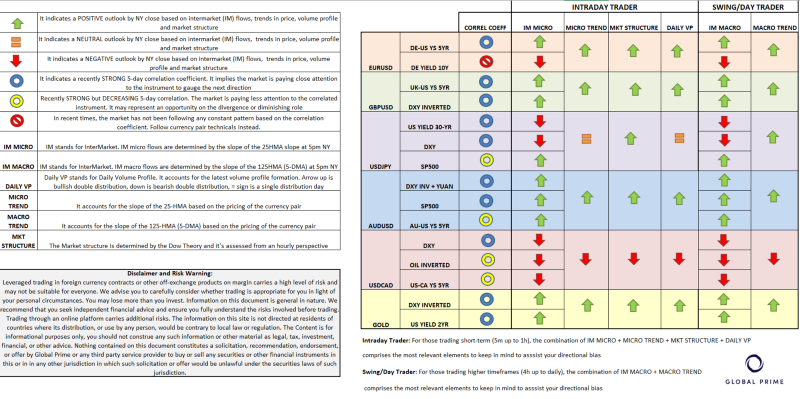
Dashboard: Intermarket Flows And Technical Analysis
EUR/USD: Uptrend Develops, Further Upside Eyed

The outlook for the euro in the next 24h is unambiguously bullish. The dashboard above represents the positive outlook, with both technicals and intermarket flows converging to expect further demand imbalances. What’s also important is to acknowledge that in the scenario that the EUR/USD trend really takes off, we are just coming out of a macro trend as per the prolonged downward slope of the 5-DMA (125-HMA), which means that from a risk-reward perspective, this could be a potentially attractive period to build long positions in order to capitalize on the broad-based USD weakness. The chart, from a technical perspective, is a thing of beauty. We’ve validated a new swing high by finding acceptance above 1.1330, which means we can now draw an ascending trendline. Besides, most of the volume transacted in the last 24 (POC) has been trapped behind the close. Talking about the close, the currency pair has finished at the very high, which speaks volumes of the lack of supply. Allow me to also remark that the 125-HMA slope has finally turned north, while the German vs U.S. yield spread, which has been playing a greater role in the carving of the bottom, did spike yesterday. Overall, this is a market that has all the credence for buy-side strategies to do well.
GBP/USD: Let Some Air Come Out From The GBP Balloon

The outlook for the pound looks quite bright. The move in the pound has been by far the most aggressive in the last 24h, which puts us in a difficult position to find good opportunities to engage in buy-side action unless your strategy is based upon momentum or some type of scalping that gets you in and out of the market fairly quickly. The reason I am saying that is because we are quite overstretched by any measure you deploy. We’ve run over 300 pips to the upside in just 3 days, so with such an average of 100p/day, it’s difficult to find value. The technicals and intermaket flows are definitely in alignment for further upside, but I personally think that some air must first come out of the GBP balloon before considering to buy and hold strategies. Anything can happen, and the combination of positive Brexit headlines alongside the yuan strength story dragging on can further expand the momentum, but when all things considered, this market needs some type of correction before the risk-reward becomes relatively attractive.
USD/JPY: Upside Far From Being A Clear Cut

If you are looking to be a buyer on this market, extreme caution is be required, as the broad-based USD weakness has resulted in both the DXY and long-dated U.S. yields trending lower from both a micro and macro flows standpoint. In the vast majority of cases, unless aggressive buy-side action is seen in equities to offset this negative input, any USD/JPY recovery should be met with grateful sellers at what would be perceived as discounted prices. If the scenario doesn’t play out, note that the renewed dovish commitment by BOJ Kuroda may be an extra layer of short-term weakness for the Yen one must account for. The greater the base money in an economy via the expansion of a Central Bank’s balance sheet, the more detrimental for the currency on excessive supply in circulation. That said, the Yen is still very much a risk-on/risk-off & DXY/US yields story, so as the picture stands, don’t hold your breath for the upside to be as exploitable as other G10 FX vs USD.
AUD/USD: The Most Bullish It’s Been In February

If you revisit yesterday’s dashboard, you’d notice the short-term flows were in complete alignment for the Aussie to be a buy on weakness market. Fast forward to today’s price action, and we are still presented with an even improved picture as technicals and intermarket flows stay in agreement. The dashboard above is an absolute sea of green, and while anything can happen intraday that may alter this view, the way I can only go about these analyses is to take the 5pm NY close as reference, and the chart is giving us all types of hints that the path of least resistance should be higher. The validation of the new leg higher in prices allows us to draw an ascending trendline, which should serve us well as a visual representation of the constructive outlook for this market. Judging by the close in highly correlated instruments such as the yuan or equities, don’t be surprised if strategies look to exploit this market via shallow pullbacks. A retest of the 25-HMA as guide would be an ideal starting point, with other discretionary elements based on one’s own preferences to be applied before entry.
USD/CAD: Go With the Flow, Lower Prices Eyed

Analogous to what we are seeing in the Aussie market, although not as intense the imbalance, the Canadian dollar is also flying higher against a battered U.S. dollar. Based on technicals and intermarket flows, there is only one way I’d personally be playing this market if the idea is to get the most bang for one’s buck, and that’s to the downside. Look to short from areas that make technical sense to you and if you are looking to engage in buy-side action with you trade duration short-term, be aware that you’d be swimming upstream against strong currents as Oil continues to fly higher and the DXY is dethroned from the best-performing currency just days ago to outright selling. On the latter, that’s a testament of how short-term flow driven these markets are, the USD can go through a stellar 2-week bull run only to revert and sell-off quite aggressively for days.
Gold: The Max Expression Of USD Weakness

If there is a market that expresses like no other the depressed state of affairs in the performance of the USD, look no further, Gold is the answer. The yellow metal has been catapulted to fresh yearly highs, capitalizing like no other asset class the weakness in the USD. Even yesterday I mentioned that the run higher on Monday felt overstretched based on the lagging DXY/U.S. 2yr yields. Notwithstanding we find ourselves with a much more elevated gold valuation, the impulsive nature of the bear run in the U.S. yields alongside the DXY has managed to build up an awful lot of momentum that is dangerous to fight. Testament of that is the extension of gains in Asia as I type. This market is a buy on weakness as the intermarket flows stand but as in the case of the pound, we should be aware that the expansion in prices is not likely to be sustainable as the demand is likely to dry up under normal circumstances. If you are an intraday momentum trader, I can understand why you’d be inclined to potentially exploit this market at every opportunity you spot.
Important Footnotes
- Risk model: The fact that financial markets have become so intertwined and dynamic makes it essential to stay constantly in tune with market conditions and adapt to new environments. This prop model will assist you to gauge the context that you are trading so that you can significantly reduce the downside risks. To understand the principles applied in the assessment of this model, refer to the tutorial How to Unpack Risk Sentiment Profiles
- Cycles: Markets evolve in cycles followed by a period of distribution and/or accumulation. The weekly cycles are highlighted in red, blue refers to the daily, while the black lines represent the hourly cycles. To understand the principles applied in the assessment of cycles, refer to the tutorial How To Read Market Structures In Forex
- POC: It refers to the point of control. It represents the areas of most interest by trading volume and should act as walls of bids/offers that may result in price reversals. The volume profile analysis tracks trading activity over a specified time period at specified price levels. The study reveals the constant evolution of the market auction process. If you wish to find out more about the importance of the POC, refer to the tutorial How to Read Volume Profile Structures
- Tick Volume: Price updates activity provides great insights into the actual buy or sell-side commitment to be engaged into a specific directional movement. Studies validate that price updates (tick volume) are highly correlated to actual traded volume, with the correlation being very high, when looking at hourly data. If you wish to find out more about the importance tick volume, refer to the tutorial on Why Is Tick Volume Important To Monitor?
- Horizontal Support/Resistance: Unlike levels of dynamic support or resistance or more subjective measurements such as fibonacci retracements, pivot points, trendlines, or other forms of reactive areas, the horizontal lines of support and resistance are universal concepts used by the majority of market participants. It, therefore, makes the areas the most widely followed and relevant to monitor. The Ultimate Guide To Identify Areas Of High Interest In Any Market
- Trendlines: Besides the horizontal lines, trendlines are helpful as a visual representation of the trend. The trendlines are drawn respecting a series of rules that determine the validation of a new cycle being created. Therefore, these trendline drawn in the chart hinge to a certain interpretation of market structures.
- Correlations: Each forex pair has a series of highly correlated assets to assess valuations. This type of study is called inter-market analysis and it involves scoping out anomalies in the ever-evolving global interconnectivity between equities, bonds, currencies, and commodities. If you would like to understand more about this concept, refer to the tutorial How Divergence In Correlated Assets Can Help You Add An Edge.
- Fundamentals: It’s important to highlight that the daily market outlook provided in this report is subject to the impact of the fundamental news. Any unexpected news may cause the price to behave erratically in the short term.
- Projection Targets: The usefulness of the 100% projection resides in the symmetry and harmonic relationships of market cycles. By drawing a 100% projection, you can anticipate the area in the chart where some type of pause and potential reversals in price is likely to occur, due to 1. The side in control of the cycle takes profits 2. Counter-trend positions are added by contrarian players 3. These are price points where limit orders are set by market-makers. You can find out more by reading the tutorial on The Magical 100% Fibonacci Projection