
In the past week, Latin American carriers — Azul (NYSE:AZUL) and Copa Holdings (NYSE:CPA) — outperformed with respect to the bottom line in first-quarter 2019. However, quarterly earnings declined year over year for both companies. While Azul’s results were hurt by the 16.3% depreciation of the Brazilian real, weak pricing hurt Copa’s performance.
On the non-earnings front, the likes of JetBlue Airways (NASDAQ:JBLU) and Allegiant Travel Company (NASDAQ:ALGT) unveiled their respective traffic reports for April. Load factor (% of seats filled by passengers) declined at both carriers as capacity expansion outweighed traffic growth.
Additionally, the Bureau of Transportation Services (BTS) revealed that average airfares in the United States increased (on an unadjusted basis) in April.
(Read the last Airline Stock Roundup here).
Recap of the Past Week’s Most Important Stories
1. Azul’s first-quarter 2019 earnings of 49 cents beat the Zacks Consensus Estimate of 43 cents. However, the bottom line declined 14% year over year. Operating revenues totaled $686.8 million, which missed the Zacks Consensus Estimate of $694.1 but improved year over year. This upside can be primarily attributed to high passenger revenues. Notably, passenger revenues, accounting for bulk (95.8%) of the top line, rose 15.3% on a year-over-year basis backed by solid demand for air travel among other factors. (Read more: Azul Q1 Earnings Beat, Fall Y/Y on Currency Headwind)
Azul carries a Zacks Rank #3 (Hold). You can see the complete list of today’s Zacks #1 Rank (Strong Buy) stocks here.
2. Copa Holdings’ first-quarter 2019 earnings of $2.11 per share outpaced the Zacks Consensus Estimate of $1.64. However, the bottom line declined 34.5% year over year. Downturn in some Latin-American economies and lower revenues negatively impacted the company’s results. Meanwhile, quarterly revenues declined nearly 6% year over year to $672.2 million and also marginally missed the Zacks Consensus Estimate of $672.3 million. This downturn was due to a 6.6% decrease in passenger revenues. While passenger unit revenue per available seat mile (PRASM) fell 8.4%, yield per passenger mile was down 8.8%. (Read more: Copa Holdings Q1 Earnings Top, Down Y/Y on Weak Revenues)
3. At JetBlue, traffic (measured in Revenue Passenger Miles or RPMs) increased 6.6% year over year to 4.59 billion. Consolidated capacity (or available seat miles/ASMs) expanded 7.4% to 5.39 billion on a year-over-year basis. Load factor contracted 60 basis points (bps) to 85.1%. This Long Island City, NY-based low-cost carrier registered a completion factor (system wide) of 98.6% in April, with 73.4% flights on schedule. (Read more: JetBlue's Traffic Rises But Load Factor Declines in April)
4. At Allegiant, RPMs increased 11.1% on a year-over-year basis to 1.17 billion. Meanwhile, ASMs expanded 16.1% to 1.47 billion in the month. However, load factor contracted 360 basis points year over year to 79.6%. In April 2019, Allegiant transported 10.2% more passengers compared with the year-ago period number. (Read more: Allegiant's April Traffic Rises, Load Factor Falls)
5. According to data released by the BTS, average airfares (unadjusted) increased 3.5% in April. On a seasonally-adjusted basis, airfares declined 0.1% in the same month. Recently, carriers like Southwest Airlines (NYSE:LUV) have increased ticket prices. Moreover, travel website Hopper has reportedly predicted that individual ticket prices for domestic round-trip (on an average) will rise to $240 by June from $229 in April.
Price Performance
The following table shows the price movement of the major airline players over the past week and during the last six months.
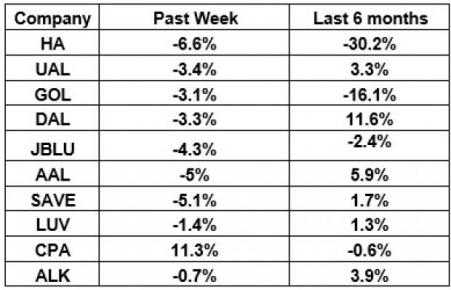
The table above shows that majority of the airline stocks traded in the red over the past week. Consequently, the NYSE ARCA Airline Index declined 2.6% to $98.97. Apart from disappointing traffic reports, the escalation of trade war tensions between the United States and China resulted in the downturn.
Over the course of six months, the NYSE ARCA Airline Index depreciated 3%.
What's Next in the Airline Space?
Investors will keenly await LATAM Airlines Group’s (NYSE:LTM) first-quarter 2019 earnings report scheduled to be released on May 16.
Today's Best Stocks from Zacks
Would you like to see the updated picks from our best market-beating strategies? From 2017 through 2018, while the S&P 500 gained +15.8%, five of our screens returned +38.0%, +61.3%, +61.6%, +68.1%, and +98.3%.
This outperformance has not just been a recent phenomenon. From 2000 – 2018, while the S&P averaged +4.8% per year, our top strategies averaged up to +56.2% per year.
See their latest picks free >>
Southwest Airlines Co. (LUV): Free Stock Analysis Report
Allegiant Travel Company (ALGT): Free Stock Analysis Report
JetBlue Airways Corporation (JBLU): Free Stock Analysis Report
Copa Holdings, S.A. (CPA): Free Stock Analysis Report
LATAM Airlines Group S.A. (LTM): Free Stock Analysis Report
AZUL SA (AZUL): Free Stock Analysis Report
Original post