
Summary- The S&P 500 (SPX) fell last week by 60 points to 2743, a decline of 2.1%.
- The weak market was due in part to disappointing economic data and signs that the trade war is having an impact on the U.S. and China.
- Our projection this week is for choppy price action in the stock market, before ending the week with a push higher.
S&P 500 (SPX) Daily Chart 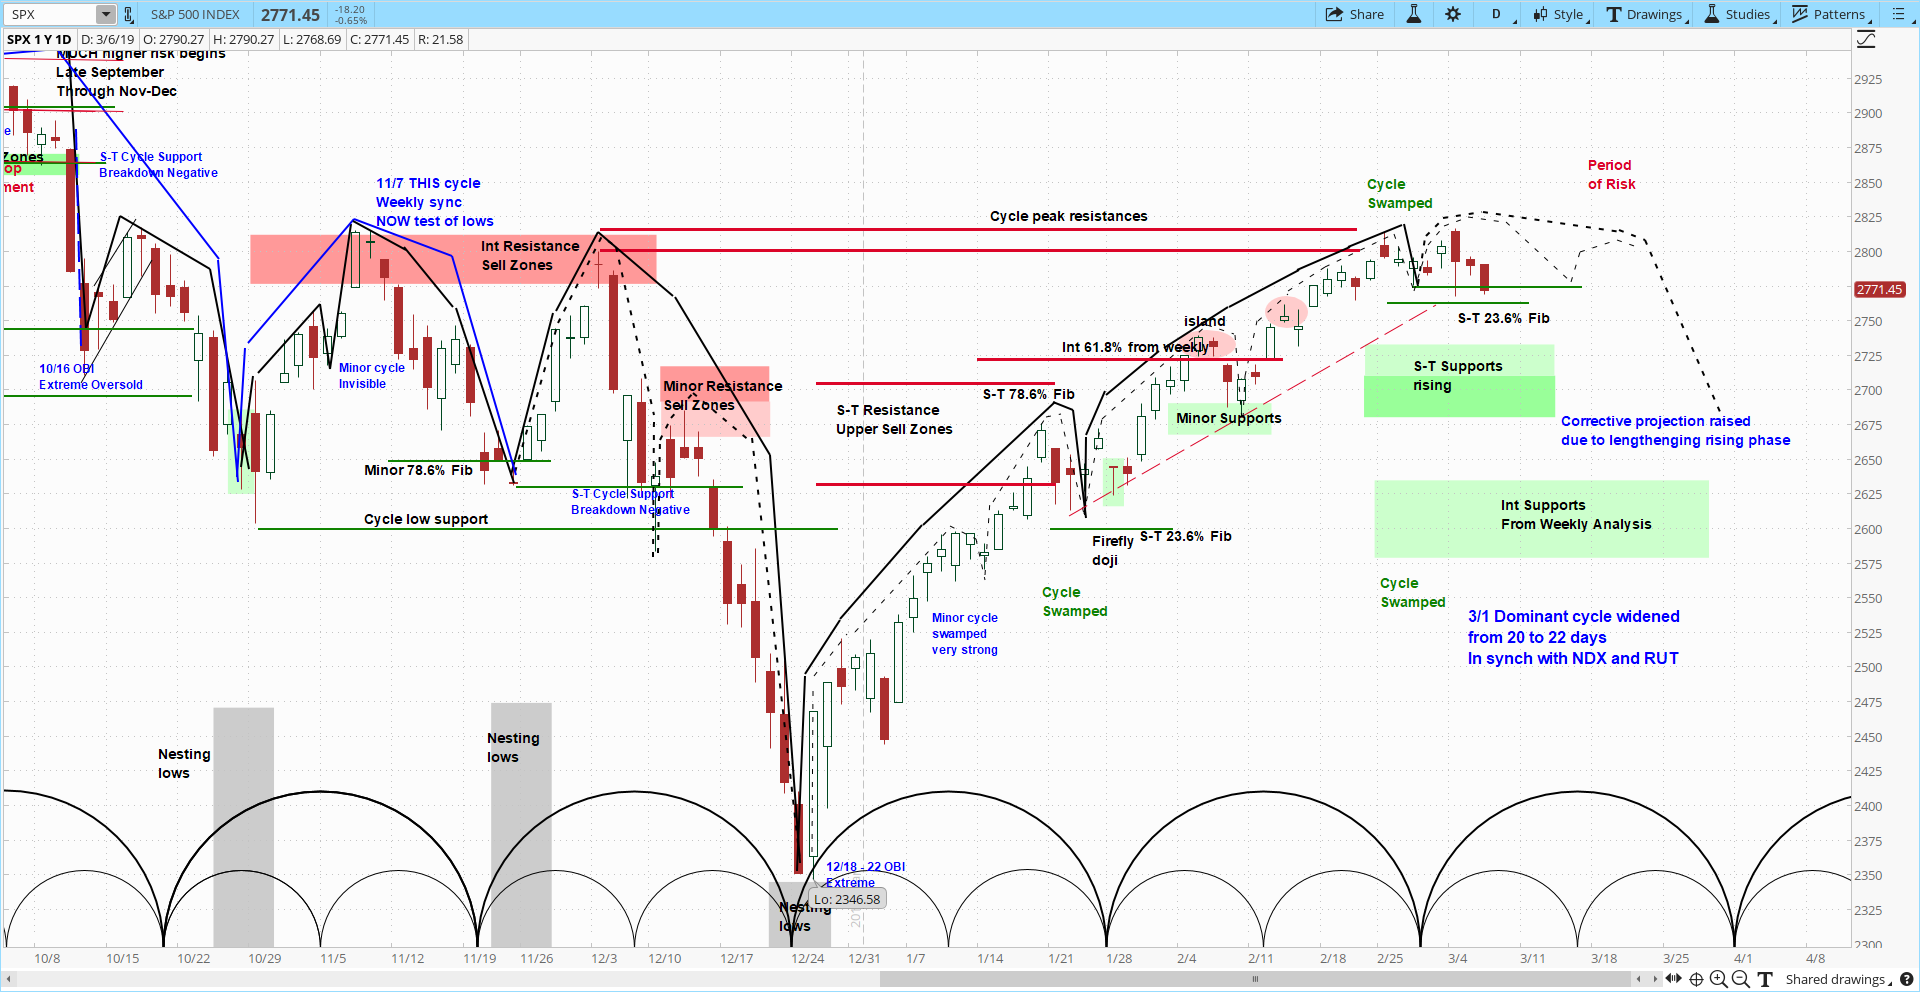
The stock market moved steadily lower last week as the S&P 500 failed at a key resistance level. After a 20% rally that lasted 10 weeks, investors saw reason to lighten up their risk.
The five straight days of lower price action in the S&P 500 was spurred in part by slowing world growth. The European Central Bank (ECB) for example decreased its growth projections to 1.1% from last December’s 1.7% forecast.
Yet ECB President Mario Draghi did express optimism: “We assessed the probabilities of a recession as being very low. The probabilities of a de-anchoring in inflation expectations are also very low in our assessment.”
Furthermore, multiple reports indicated that trade between the U.S. and China was worsening. For example, the U.S. Commerce Department reported that the December 2018 trade deficit with China spiked to its highest level since Oct 2018.
The worsening trade situation was confirmed when the Chinese government reported that Feb 2019 exports to the US fell by 20.7% compared to a year earlier, which was below analyst estimates of only 4.8%.
Finally, the U.S. government reported February nonfarm payrolls of only 20,000 net new jobs, well below the expectation of 181,000.
President Trump’s view focused on one positive aspect of the report, “The big news was that wages went up. And that's great for the American worker. That's something people — I don't know if they ever expected to see it.”
But the market chose to focus on the downside last week, even though some data surprised to the upside, such as building permits and new home sales.
The bottom line is that the sellers winning again. It was comical in previous weeks to see analysts stating that a two-month bear market in late-2018 was over and a new bull market had started. Our forecast, based on long term market cycles, suggests that this bear market has only just begun.
Our approach to technical analysis as we noted uses market cycles to project price action. Each week we forecast price action based on the short term cycles such as those found on the daily chart above.
After dipping into a support zone between 2708 and 2680, we finished last week at 2743. As we are still in the declining phase of the current minor cycle, we expect more choppy action to the downside, before the next minor cycle begins and we move higher again. Then, in the week that follows, we expect downside pressure to intensify.