AT40 = 66.3% of stocks are trading above their respective 40-day moving averages (DMAs) – Day #1 of an overbought period
AT200 = 63.6% of stocks are trading above their respective 200DMAs
VIX = 11.9
Short-term Trading Call: bullish
When traders closed up shop on Friday, I am guessing they assumed, as I did, that the U.S. government would figure out something at the last minute to avoid a shutdown. Fail.
The volatility index, the VIX, was dropping fast, so I moved quickly to make a play on a relief in tensions in the coming week by buying a call option on ProShares Short VIX Short-Term Futures (NYSE:SVXY). The market was generous enough to let me exit my ProShares Ultra VIX Short-Term Futures (NYSE:UVXY) call options at a profit the previous day. In my last Above the 40 post I complained about UVXY’s inability to respond in kind to the rally in the VIX.
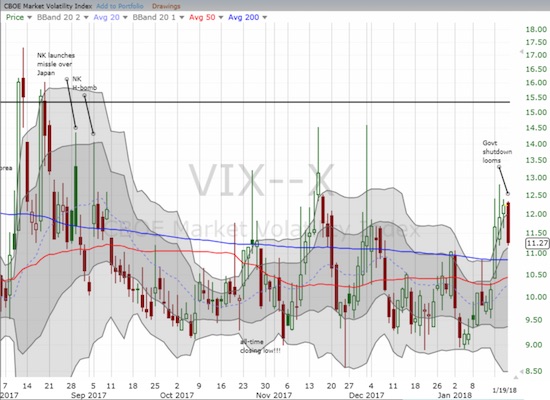
After staying elevated and gaining 9 out of the previous 10 trading days, the VIX lost 7.8%.
The VIX’s recent rise did not stop the upward momentum of the S&P 500 (via SPDR S&P 500 (NYSE:SPY)) so no surprise that Friday’s volatility implosion came alongside a fresh all-time high for the S&P 500 (SPY).
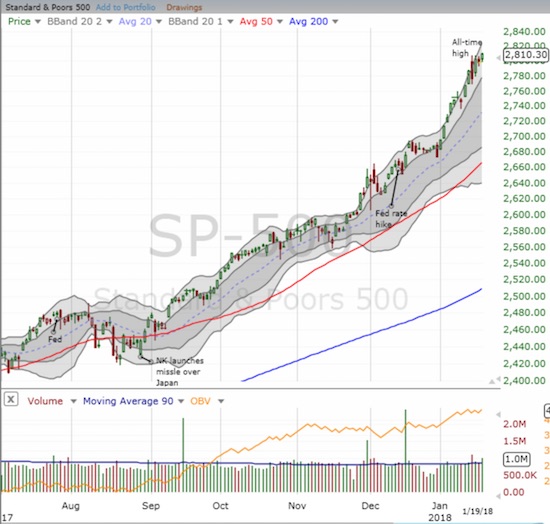
The S&P 500 (SPY) has mostly ignored the noise and the drama on its way to a fresh sequence of all-time highs.
AT40 (T2108), the percentage of stocks trading above their respective 40-day moving averages (DMAs), jumped from 63.4% to 68.3%. AT40 was down big two days this week, so, once again, it has some catching up to prevent another round of bearish divergence with the S&P 500.
The recent resilience of the S&P 500 (SPY) in the face of rising volatility has me poised to fade any fresh run-up in volatility as a result of the shutdown of the U.S. government. I will also be looking to buy into dips on favorite stocks unless an earnings report is right around the corner for that stock. The most attractive plays should be post-earnings dips to or toward key support levels. I am betting that the resolution of the latest squabbling in Washington D.C. will be celebrated by financial markets with a fresh scramble to buy. Regardless, I do not want to chase the sellers UNLESS the S&P 500 breaks my line in the sand at 2,736.
STOCK CHART REVIEWS
Electro Scientific Industries Inc (NASDAQ:ESIO)
Keeping track of stocks and maintaining a mental list of favorites can be tedious and manual work. These days, I am trying to get better at checking out SwingTradeBot, a platform for automating the process of finding trading opportunities created by my old trading mentor. ESIO was one stock that intrigued me from “Mike’s Notes” that came on January 3rd with the enticing analysis of “This is FINALLY lifting off from its 50-day moving average. It’s got a nice collection of signals on this today. It’s no wonder why I found it on the ‘Most Bullish Alerts’ scan..”
The next day the stock started falling and at the 50DMA I loaded up on call options. Much to my dismay, ESIO continued to sell off and my call options whittled down to a stub. Seeing no news to explain the sudden drop, I stubbornly doubled down but added a put option just in case some huge implosion was in the works. I was greatly rewarded last Thursday when the stock soared over 19% a day after jumping 9.5%. I sold my position at that point.
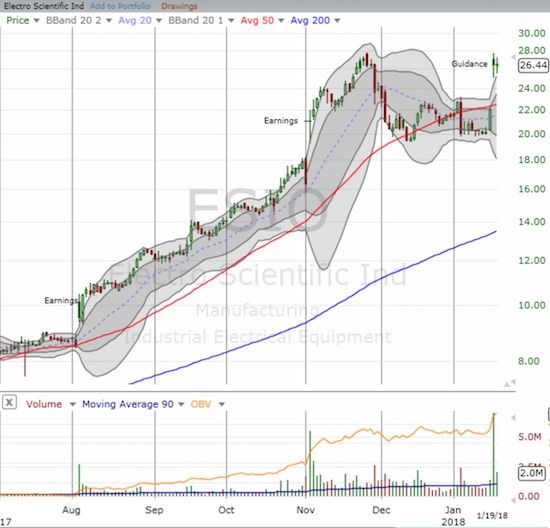
Electro Scientific (ESO) shook off a 50DMA breakdown to gap back up its all-time high.
The lessons here are not straightforward but important. Sure, a little luck helped here. Still, using options allowed me to set up an asymmetric trade with small risk and a lot of upside opportunity. Moreover, I was measured in my interpretation of the price action. I stuck with the bullish interpretation because the one day sell-off failed to break the low from December. If I had not yet entered a trade, I would have assumed the sudden jump ahead of the earnings guidance was a sign that support was successfully tested and the all-clear to buy was back.
In the end, the big move around earnings guidance simply returned ESIO to its previous post-earnings momentum. I do not know why the enthusiasm waned only that the pullback created tremendous upside potential.
Ulta Beauty Inc (NASDAQ:ULTA)
ULTA is one of those stocks I regularly review. The stock is back to its 200DMA resistance, and I fully expect it to break through sooner rather than later. The stock recovered its post-upgrade gain as I expected. Assuming the government shutdown generates a bit of selling on Monday, I want to add to my shares with call options.
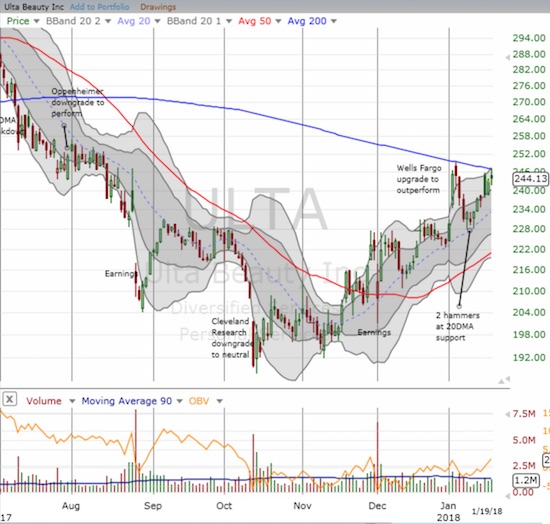
Ulta Beauty (ULTA) looks ready for a 200DMA breakout.
International Business Machines (NYSE:IBM)
Speaking of earnings, IBM had a tough one last week. It was hard for IBM to deliver with such a large run-up going into earnings despite its history of disappointments. I decided to take a chance and buy into this dip even though the stock gapped down right past last week’s encouraging gap up. I am looking for the uptrending 20DMA to hold as support where buyers and optimists will regather themselves. Note in the chart below how neatly IBM filled its October post-earnings gap up and (sloppily) held 50DMA support.
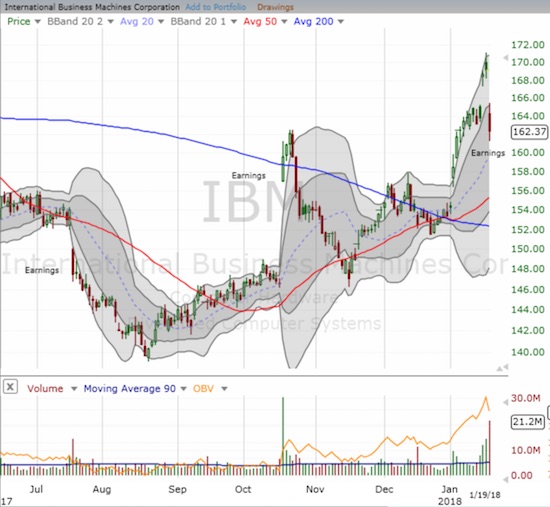
International Business Machines (IBM) failed to live up to big expectations going into earnings.
Newater Technology Inc (NASDAQ:NEWA)
The latest installment of crypto/blockchain mania descended upon a Chinese waste water treatment company. NEWA, a recent IPO, announced a strategic partnership with NW Blockchain Limited (NWBL):
“The partners will focus on building a traceable, transparent, and highly-secured platform for wastewater treatment opportunities and transactions. The partners expect to develop a blockchain token system that will be backed by the assets and the revenues from the wastewater treatment projects invested by NWBL and operated and managed by Newater. Investors will be able to purchase tokens from NWBL.
For each wastewater treatment project identified by both partners, NWBL will fund the project and purchase the wastewater treatment equipment from the Company. The Company will then manage and operate those projects. During the lifetime of the project, NWBL will pay the Company 20% of the project proceeds for managing and operating the project annually.”
Note that NEWA did not publish the news on its the company website. Regardless, the mania passed much faster than other crypto/blockchain run-ups. NEWA gapped up 30.4% but promptly sold off from there. The stock is now trying to hold onto 50DMA support.
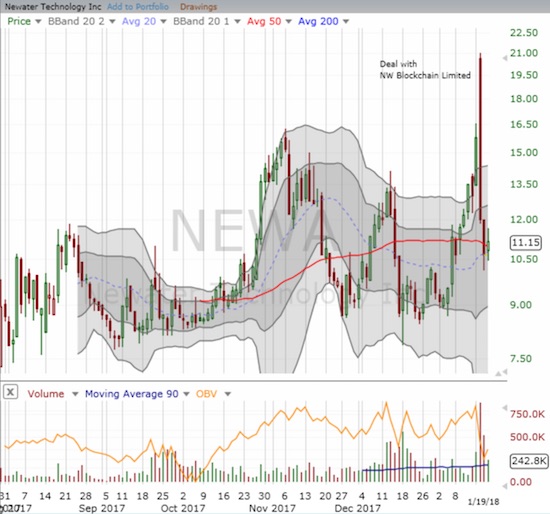
Newater Technology, Inc. (NEWA) experienced a flash of panic buying in the wake of blockchain news. The dust cleared almost as quickly.
“Above the 40” uses the percentage of stocks trading above their respective 40-day moving averages (DMAs) to assess the technical health of the stock market and to identify extremes in market sentiment that are likely to reverse. Abbreviated as AT40, Above the 40 is an alternative label for “T2108” which was created by Worden. Learn more about T2108 on my T2108 Resource Page. AT200, or T2107, measures the percentage of stocks trading above their respective 200DMAs.
Active AT40 (T2108) periods: Day #478 over 20%, Day #292 over 30%, Day #92 over 40%, Day #40 over 50%, Day #31 over 60% (overperiod), Day #4 under 70%
Daily AT40 (T2108)
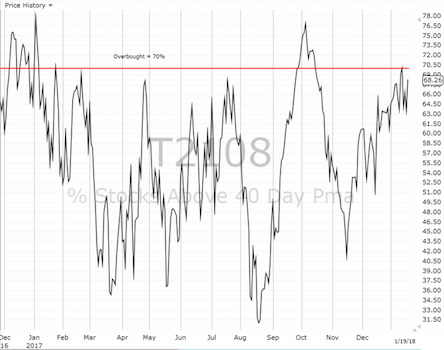
Black line: AT40 (T2108) (% measured on the right)
Red line: Overbought threshold (70%); Blue line: Oversold threshold (20%)
Weekly AT40 (T2108)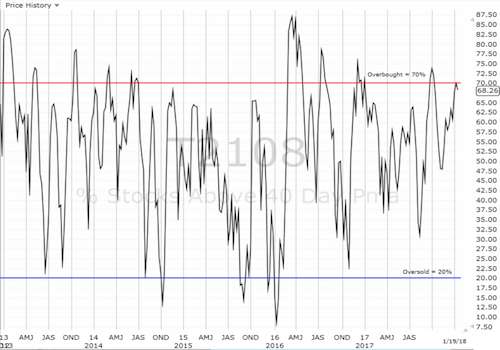
*All charts created using freestockcharts.com unless otherwise stated
Full disclosure: long SVXY call, long ULTA, long IBM calls
*Charting notes: FreeStockCharts.com uses midnight U.S. Eastern time as the close for currencies. Stock prices are not adjusted for dividends.
