AT40 = 42.5% of stocks are trading above their respective 40-day moving averages (DMAs)
AT200 = 51.5% of stocks are trading above their respective 200DMAs
VIX = 12.3 (volatility index fell 20.5%)
Short-term Trading Call: bullish
Commentary
As has been the pattern for quite some time now, the latest phase of fear fizzled out fast.
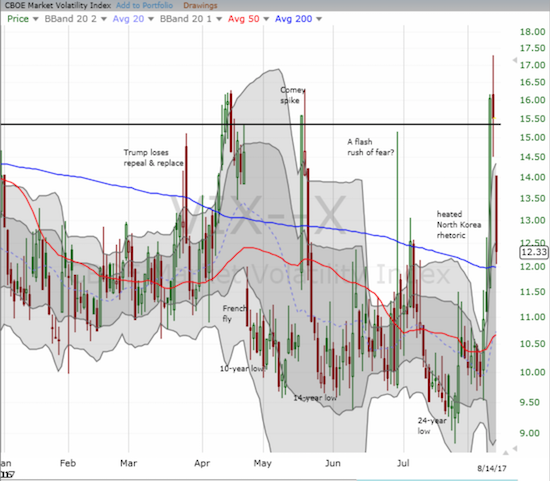
The volatility index (VIX) collapsed in what has become a regular routine of volatility spikes that last no longer than several days
The all-important 15.35 pivot line again served its purpose well. Sellers tried their best to hold the line on Friday but the collective sigh of relief on Monday was just too heavy.
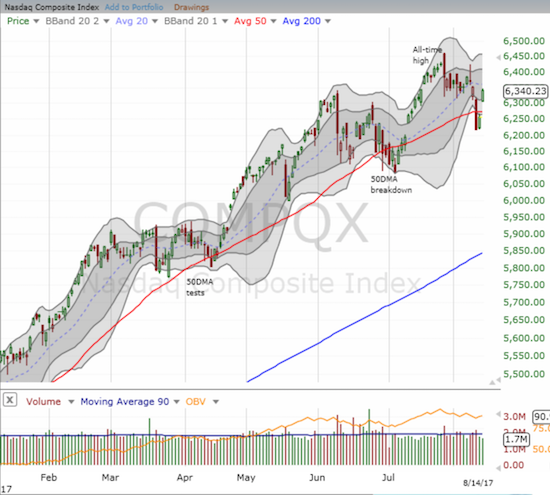
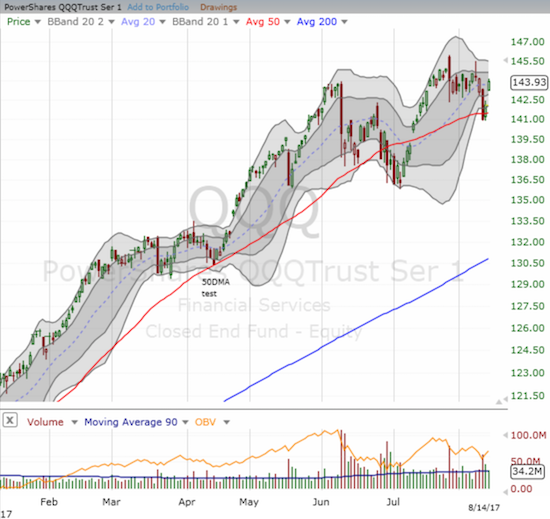
While previous episodes of volatility implosions looked like confirmations of an earlier over-reaction, THIS episode followed a more rational cycle. The scent of war was in the air last week. Going into trading today the market was treated to two genuinely good stories that greatly reduced the (apparent) risk of war: 1) China showed it is a lot more serious about the threat posed by North Korea by banning imports of seafood and iron from the rogue nuclear-tipped nation, and 2) U.S. vice-president Mike Pence walked back President Donald Trump’s threat of military action against Venezuela. The bullish impact on the major indices was unmistakeable. The S&P 500 (SPDR S&P 500 (NYSE:SPY)), the NASDAQ, and PowerShares QQQ Trust (NASDAQ:QQQ) all gapped up and over their respective 50-day moving averages (DMAs).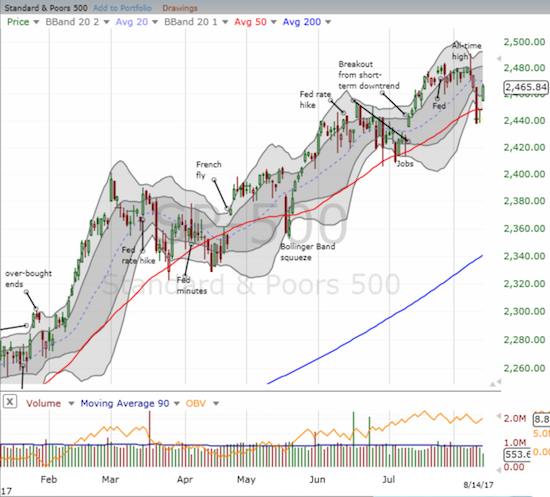
The S&P 500 (SPY) reversed the entire intraday loss from last Thursday as it gapped to a 1.05 gain on the day.
The NASDAQ almost reversed its entire loss from last Thursday as it gapped up to a 1.3% gain on the day.
The PowerShares QQQ Trust (QQQ) confirmed 50DMA support with its gap up to a 1.3% gain and near complete reversal of Thursday’s loss.
In the last Above the 40 I described the severe selling from last Thursday and wrote the following:
“If recent history holds, this VIX spike will last just a few more days at best. AT40 is low enough to help confirm a repeat of history. At 35.0%, AT40 is at a 2017 closing low and has not been this low since…last year’s Presidential election. In other words, AT40 is ‘close enough’ to oversold where buyers will feel bold enough to start shopping for ‘bargains.'”
On Monday, AT40 (T2108) confirmed the return of bullish sentiment by surging from 34.5% to 42.5%. This bull market has often bounced for a bottom when AT40 reached the mid to low 30s. This time around delivered to a tee. To play this bounce, I started buying call options on ProShares Short VIX Short-Term Futures (NYSE:SVXY).
I was a little early so only my second tranche went out profitable (a double). My accumulated call options for the weekly Apple (NASDAQ:AAPL) trade only managed to eke out so far a small profit thanks to a notable implosion of implied volatility.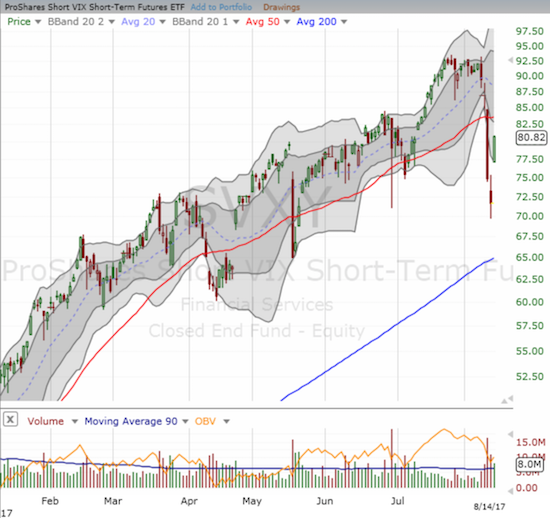
The ProShares Short VIX Short-Term Futures (SVXY) soared 12.8% as the market heaved a huge sigh of relief.
Conversely, the ProShares Ultra VIX Short-Term Futures ETF (NYSE:UVXY) plunged a whopping 26.5% and looks ready to resume setting new all-time lows.
In the past, I have typically waited for more confirmation before changing my short-term trading call. That hesitation usually cost me opportunities and encouraged me to hedge too much, too fast. So, I am flipping the short-term trading call from neutral all the way to bullish.
While I still do not think the S&P 500 will make much more headway past its all-time high until at least October, the change in trading call frees me to pursue some individual stock trades more aggressively. Granted, this upgrade leaves me vulnerable to whiplash if the 50DMA becomes a new pivot point. I am expecting some fresh (smaller) dips as the market adjusts to whatever toned down level of war rhetoric marks the new normal between Presidents Kim Jung Un and Donald Trump.
NVIDIA Corporation (NASDAQ:NVDA) was the poster child individual stock that came roaring back. NVDA reported earnings right in the thick of the market’s fears so selling was no doubt exaggerated. I took a chance and bought a call option on the test of 50DMA support.
Although NVDA ended up closing slightly below that support line, its gap up today was more than enough to deliver a double on my call option. I left a lot of money on the table though as NVDA incredibly went from a 4% intraday gain to a close of +8.0%!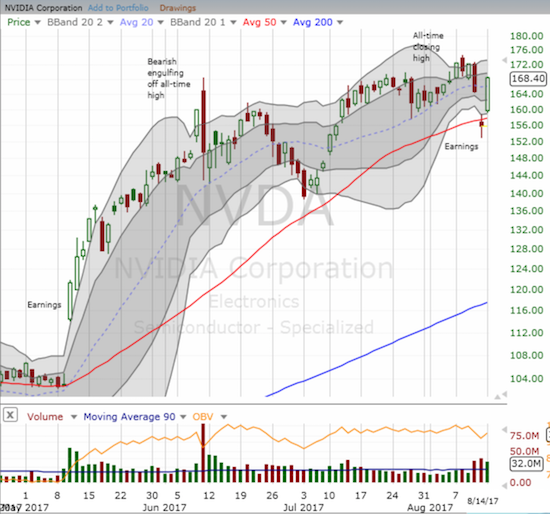
Nvidia (NVDA) came roaring back with a complete gap fill and then some!
The other usual suspects did not come close to NVDA’s fireworks, but they also did well: Apple (AAPL) gapped up 1.5% and seemed to confirm support at its previous all-time high (see chart below); Facebook (NASDAQ:FB) gapped up for a 1.6% gain and seemed to confirm 20DMA support; Alphabet (NASDAQ:GOOGL) Inc C (NASDAQ:GOOG) underperformed with a gap up and a 0.9% gain – still well below its 50DMA; Amazon.com (NASDAQ:AMZN) gapped up for a 1.6% gain – still below its 50DMA; Netflix (NASDAQ:NFLX) was the worst performer with a 0.2% LOSS thanks to a negative story from Barron’s over the weekend – with the stock hovering over 50DMA support I went ahead and speculated on call options.
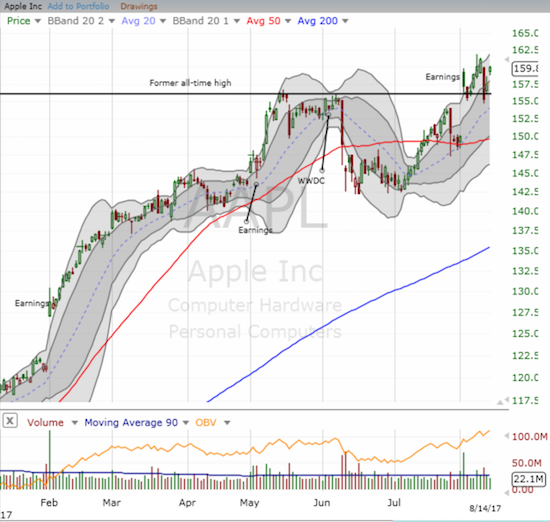
Apple (AAPL) has likely confirmed support at its former all-time high and looks ready to rip higher again.
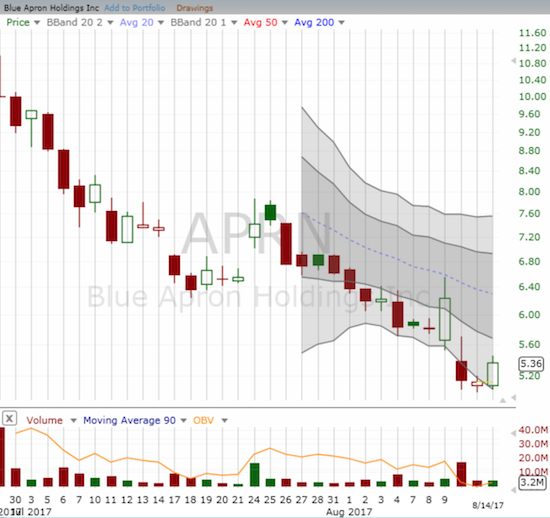
I made a big speculative play on Blue Apron Holdings Inc (NYSE:APRN). I am once again following in the footsteps of Jana Partners which swooped in on Whole Foods Market (NASDAQ:WFM) and likely helped engineer the deal with AMZN. Maybe Jana figures out a way to utilize APRN’s model to help WFM distribute cook-at-home meals through AMZN…

Blue Apron Holdings (APRN) has been beaten, pounded, skewered, and fried since its IPO. Did Jana Partners just signal this ill-fated IPO is finally sitting at fair value?
“Above the 40” uses the percentage of stocks trading above their respective 40-day moving averages (DMAs) to assess the technical health of the stock market and to identify extremes in market sentiment that are likely to reverse. Abbreviated as AT40, Above the 40 is an alternative label for “T2108” which was created by Worden. Learn more about T2108 on my T2108 Resource Page. AT200, or T2107, measures the percentage of stocks trading above their respective 200DMAs.
Active AT40 (T2108) periods: Day #377 over 20%, Day #191 over 30%, Day #1 over 40% (overperiod ending 2 days under 40%), Day #8 under 50% (underperiod), Day #14 under 60%, Day #137 under 70%
Daily AT40 (T2108)
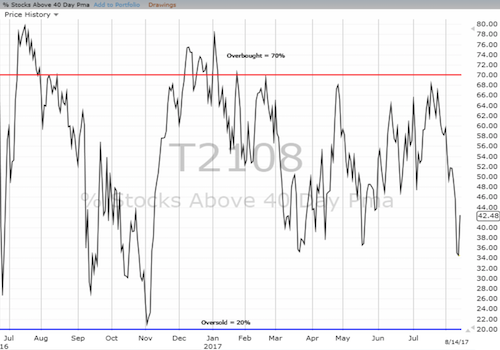
Black line: AT40 (T2108) (% measured on the right)
Red line: Overbought threshold (70%); Blue line: Oversold threshold (20%)
Weekly AT40 (T2108)
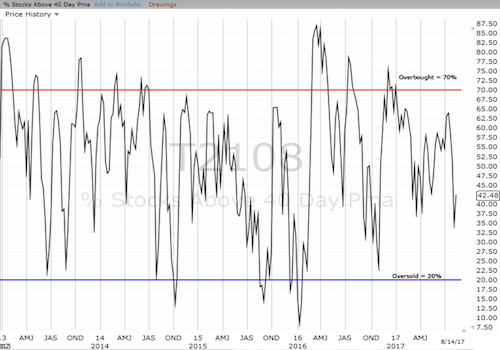
Be careful out there!
Full disclosure: long AAPL calls, long NFLX calls, long APRN shares
*Charting notes: FreeStockCharts.com uses midnight U.S. Eastern time as the close for currencies.

