Last Friday, after an 11th-hour meeting, the Eurogroup and Greek leaders finally reached a temporary agreement allowing Greece a four-month extension on the bailout program, Master Financial Assistance Facility Agreement (MFAFA), and prevent Greece’s quitting of the currency region.
However, on Monday, the Greece government will still need to hand up a series of reform policies that is in line with the current bailout requires. The Greek new administration seems to have given in to all the requests in this round of meetings, which may again irritate domestic nationalism and add uncertainty to the future of this Balkan nation and the Eurozone.
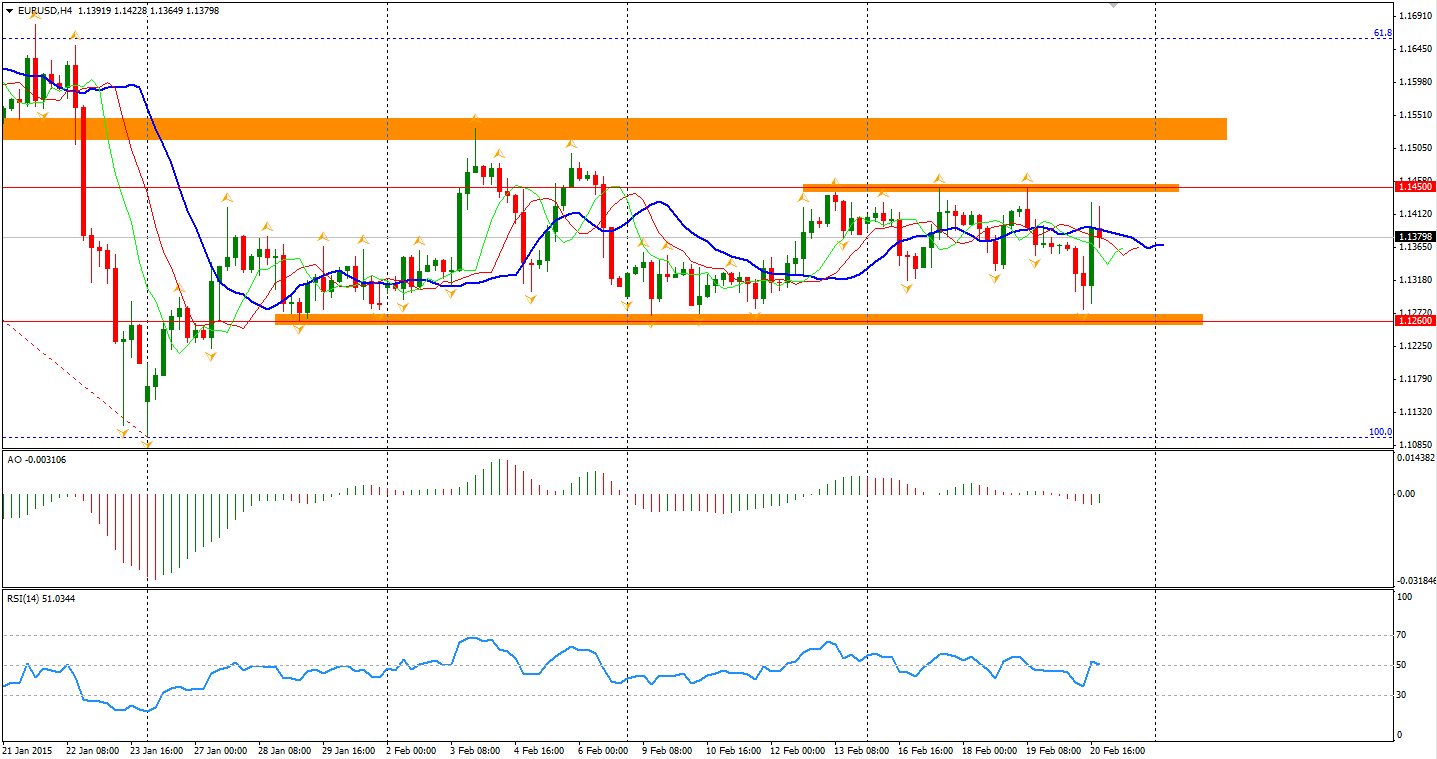
The EUR/USD continues its fluctuation on Greek and Ukraine news within the range between 1.1450 and 1.1260. Range trading strategy will still be working – up until this currency pair breaks either way of the boundary.
A notable market fact is that the US Treasury bond yield rose for its third conservative week, giving more to speculation of the Fed’s rate hike heating. The yield rise on Friday partially due to the new Greek deal reduced safe-haven needs on the Treasury. Market participants will also be betting on the testimonies Mrs Yellen will present in US Congress on the 24th and 25th. More traders believe that there will be a hike in 2015 but debate on the exact timing. If the job market remains at current trend, the pace of increasing rates may be faster than expected.
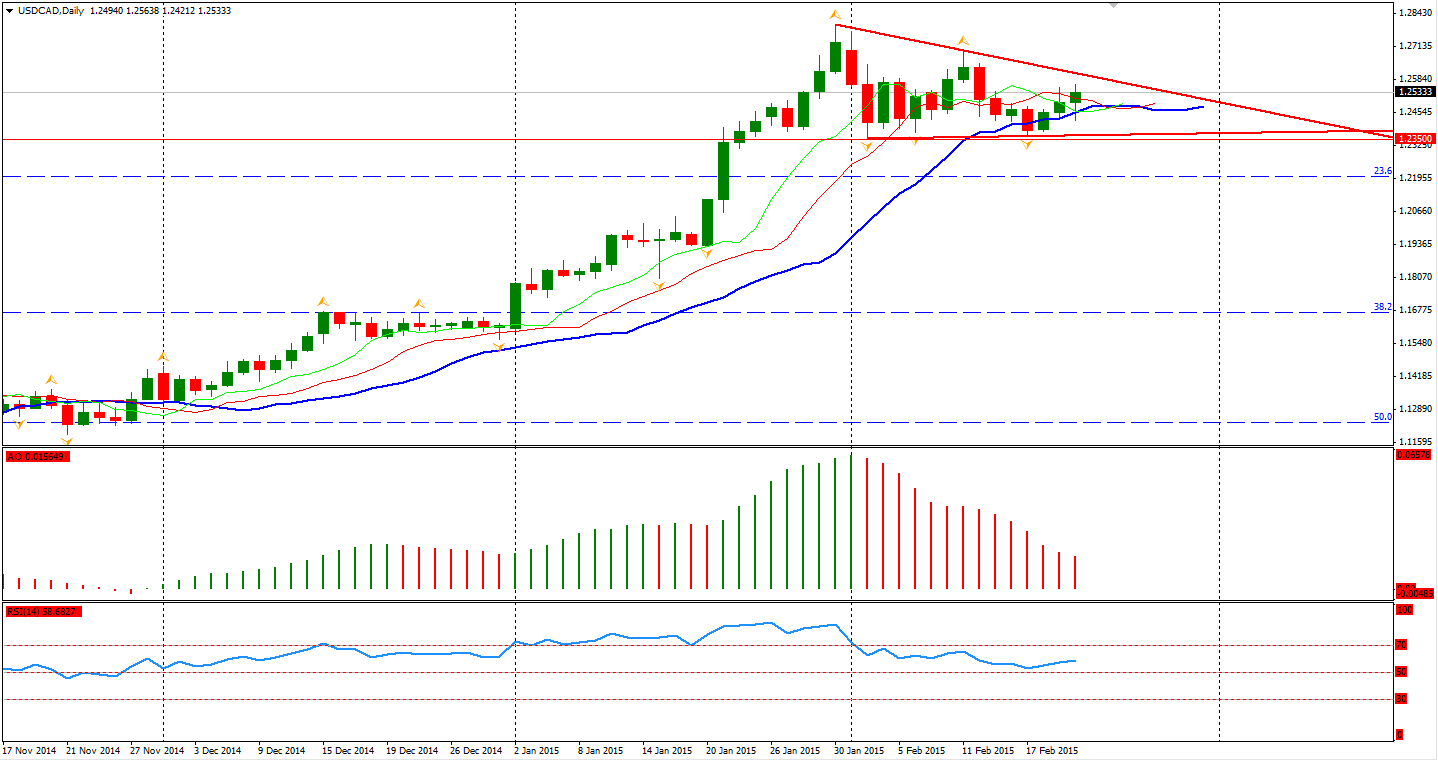
Other potential opportunities? Crude Oil prices have once again tumbled. The Canadian Dollar has also fallen against US Dollar. The triangle pattern remains and a potential breakout seems to be closing.
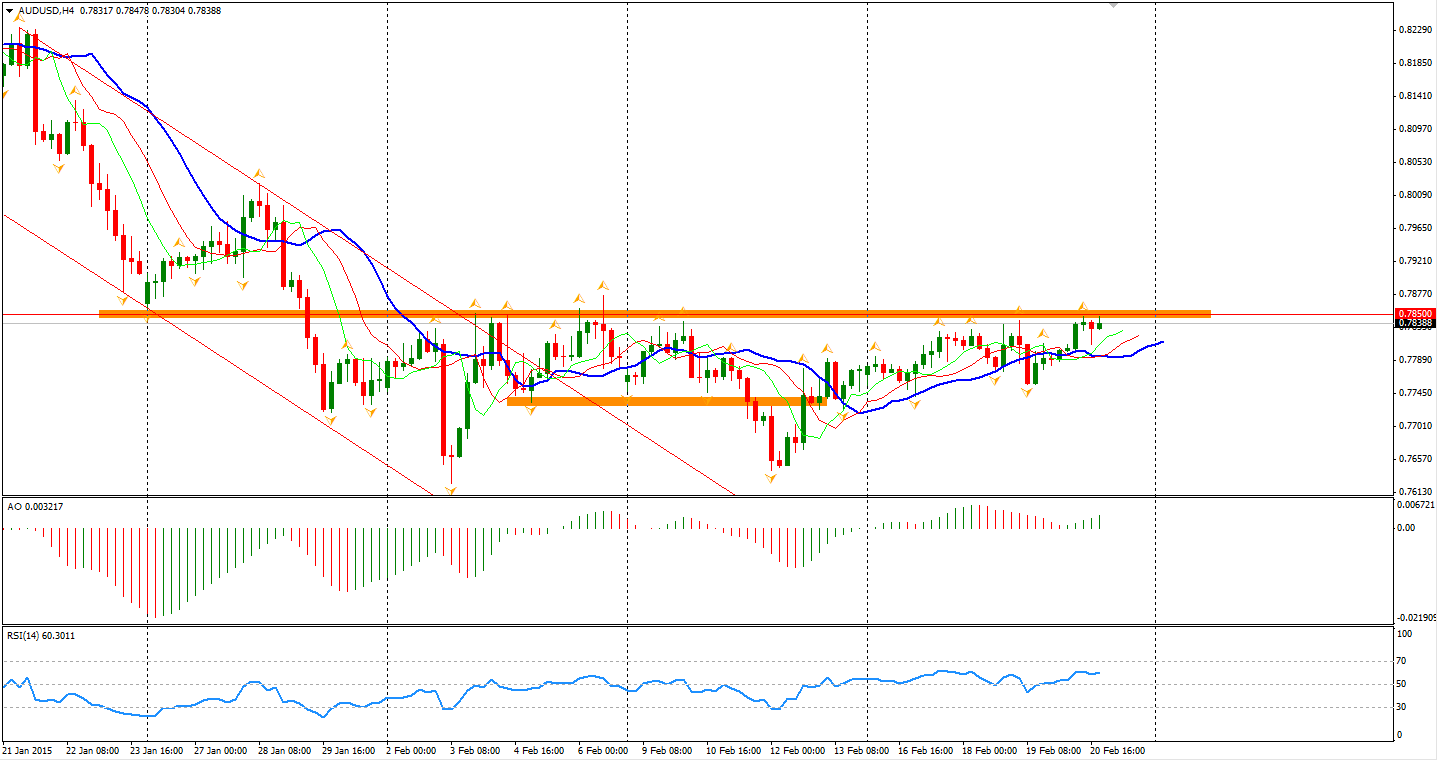
AUD/USD barely closed at around 0.7840 where a huge amount of call options lay on Friday. The resistance is very strong according to the market reaction and has never really been penetrated by 14-hour continuous attacks from the bulls. Personally, I expect the AUDUSD will not break the 0.7850 level and be pressed down to 0.77.
Turning to the stock markets, the Nikkei Stock Average gained 0.37% to 18332, refreshing its highest level in 15 years. Australia 200 200 lost 0.38% to 5881. In the European markets, the UK FTSE 100 was up 0.38%, the German DAX climbed 0.44% and the French CAC 40 Index slid by 0.1%. US stocks rose broadly on the new agreement on Greece. The S&P 500 closed 0.61% higher at 2110. The Dow climbed 0.86% to 18140, and the Nasdaq Composite Index rose 0.63% to 4956.
On the data front, BOJ’s Monetary Policy Meeting Minutes will be released at 10:50 AEDST. German Ifo Business Climate will be at 20:00 AEDST. US Existing Home Sales will be out at a couple hours after midnight at 2:00 AEDST.
