AT40 = 28.9% of stocks are trading above their respective 40-day moving averages (DMAs)
AT200 = 48.1% of stocks are trading above their respective 200DMAs
VIX = 20.6
Short-term Trading Call: cautiously bullish
Commentary
In the last Above the 40, I noted some warning signs developing on the S&P 500 (via SPDR S&P 500 (NYSE:SPY)). The trading week started without quite resolving the partly cloudy pattern. The S&P 500 (SPY) fell 0.6% and closed below its 50-day moving average (DMA). This close is technically bearish and seems to confirm the warning sign, especially with two straight days of the index selling off its high of the day right at or below the downtrending 20DMA. Yet, the loss was small enough to reduce the ominousness of the 50DMA failure .
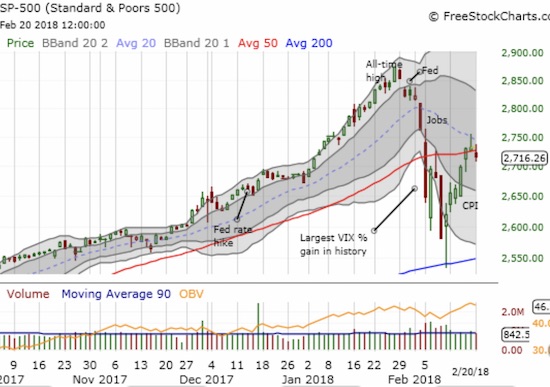
The S&P 500 (SPY) slipped back and below its important 50DMA
The iShares Russell 2000 ETF (NYSE:IWM) was more definitively bearish. The index of small caps has yet to close above its 50DMA in this post-oversold period. IWM’s fall from the high of the day created a bearish failed test of resistance.
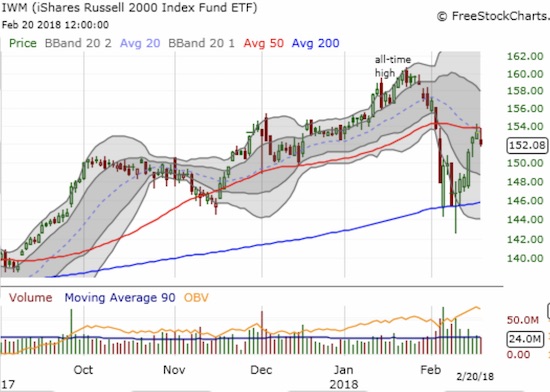
The Russell 2000 2000 ETF (IWM) failed again to close above its 50DMA resistance.
The NASDAQ also fell from its high of the day but managed to close the day flat. The PowerShares QQQ ETF (NASDAQ:QQQ) even managed to close with a marginal gain. So tech stocks are helping the market to maintain a cautiously bullish posture.
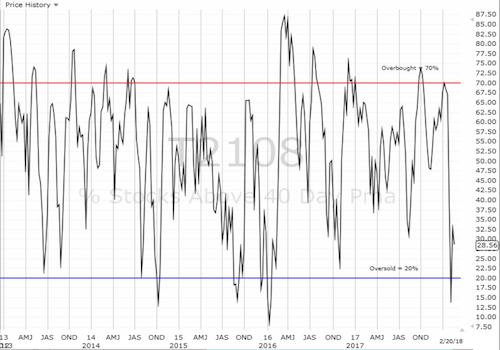
However, AT40 (T2108), the percentage of stocks trading above their respective 40DMAs, underlined the market’s setback. AT40 fell below 30% and is probably just one sell-off day away from dropping right back to oversold conditions.
Finally, the volatility index, the VIX, gained 5.9% to close at 20.6. The VIX remains elevated and demonstrates the on-going wariness among institutional investors and traders. If AT40 drops back into oversold conditions, I imagine the move will be accompanied by another surge in the VIX.
CHART REVIEWS
Chipotle Mexican Grill (NYSE:CMG)
CMG managed to get right back on my radar. Last week’s news of a new CEO lit the rockets under the stock. The stock gapped up and ended the day with a 15.4% gain. CMG has gained 26.4% in just 4 trading days.
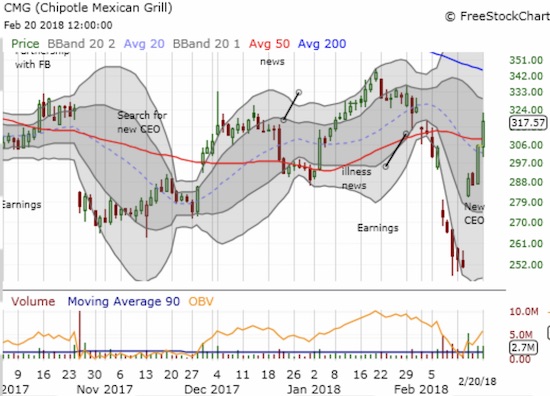
Chipotle Mexican Grill (CMG) powered right through its 50DMA resistance in the wake of news about a new CEO.
Trades related to previous posts: sold U.S. Steel (NYSE:X) shares, sold Ulta Beauty (ULTA) shares in the wake of fraud rumors, shorted iPath S&P 500 VIX ST Futures ETN (NYSE:VXX), flipped QQQ call options, sold Align Technology Inc (NASDAQ:ALGN) call option.
“Above the 40” uses the percentage of stocks trading above their respective 40-day moving averages (DMAs) to assess the technical health of the stock market and to identify extremes in market sentiment that are likely to reverse. Abbreviated as AT40, Above the 40 is an alternative label for “T2108” which was created by Worden. Learn more about T2108 on my T2108 Resource Page. AT200, or T2107, measures the percentage of stocks trading above their respective 200DMAs.
Active AT40 (T2108) periods: Day #5 over 20%, Day #1 under 30% (ending 2 days over 30%), Day #12 under 40%, Day #12 under 50%, Day #13 under 60%, Day #19 under 70%
Daily AT40 (T2108)
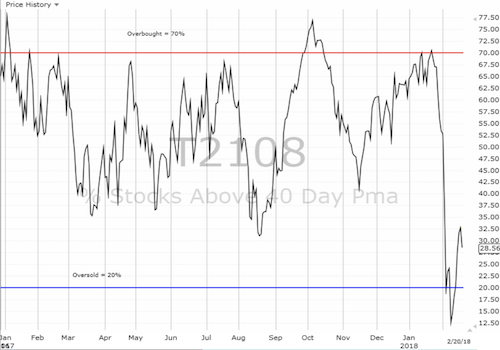
Black line: AT40 (T2108) (% measured on the right)
Red line: Overbought threshold (70%); Blue line: Oversold threshold (20%)
Weekly AT40 (T2108)
Be careful out there!
Full disclosure: short VXX
