This week’s U.S. economic news was bullish. A rise in retail sales indicates the consumer continues to spend while industrial production held its own. Industrial production held its own.Building permits – a long-leading indicator – increased. And while starts decreased slightly M/M, they were up strongly Y/Y. As for the markets, solid earnings news provide ample support for a move higher. But valuations remain high, potentially limiting additional upside moves.
Economic Review
Retail sales, a coincident indicator, rose ,4% M/M and 5.6% Y/Y:
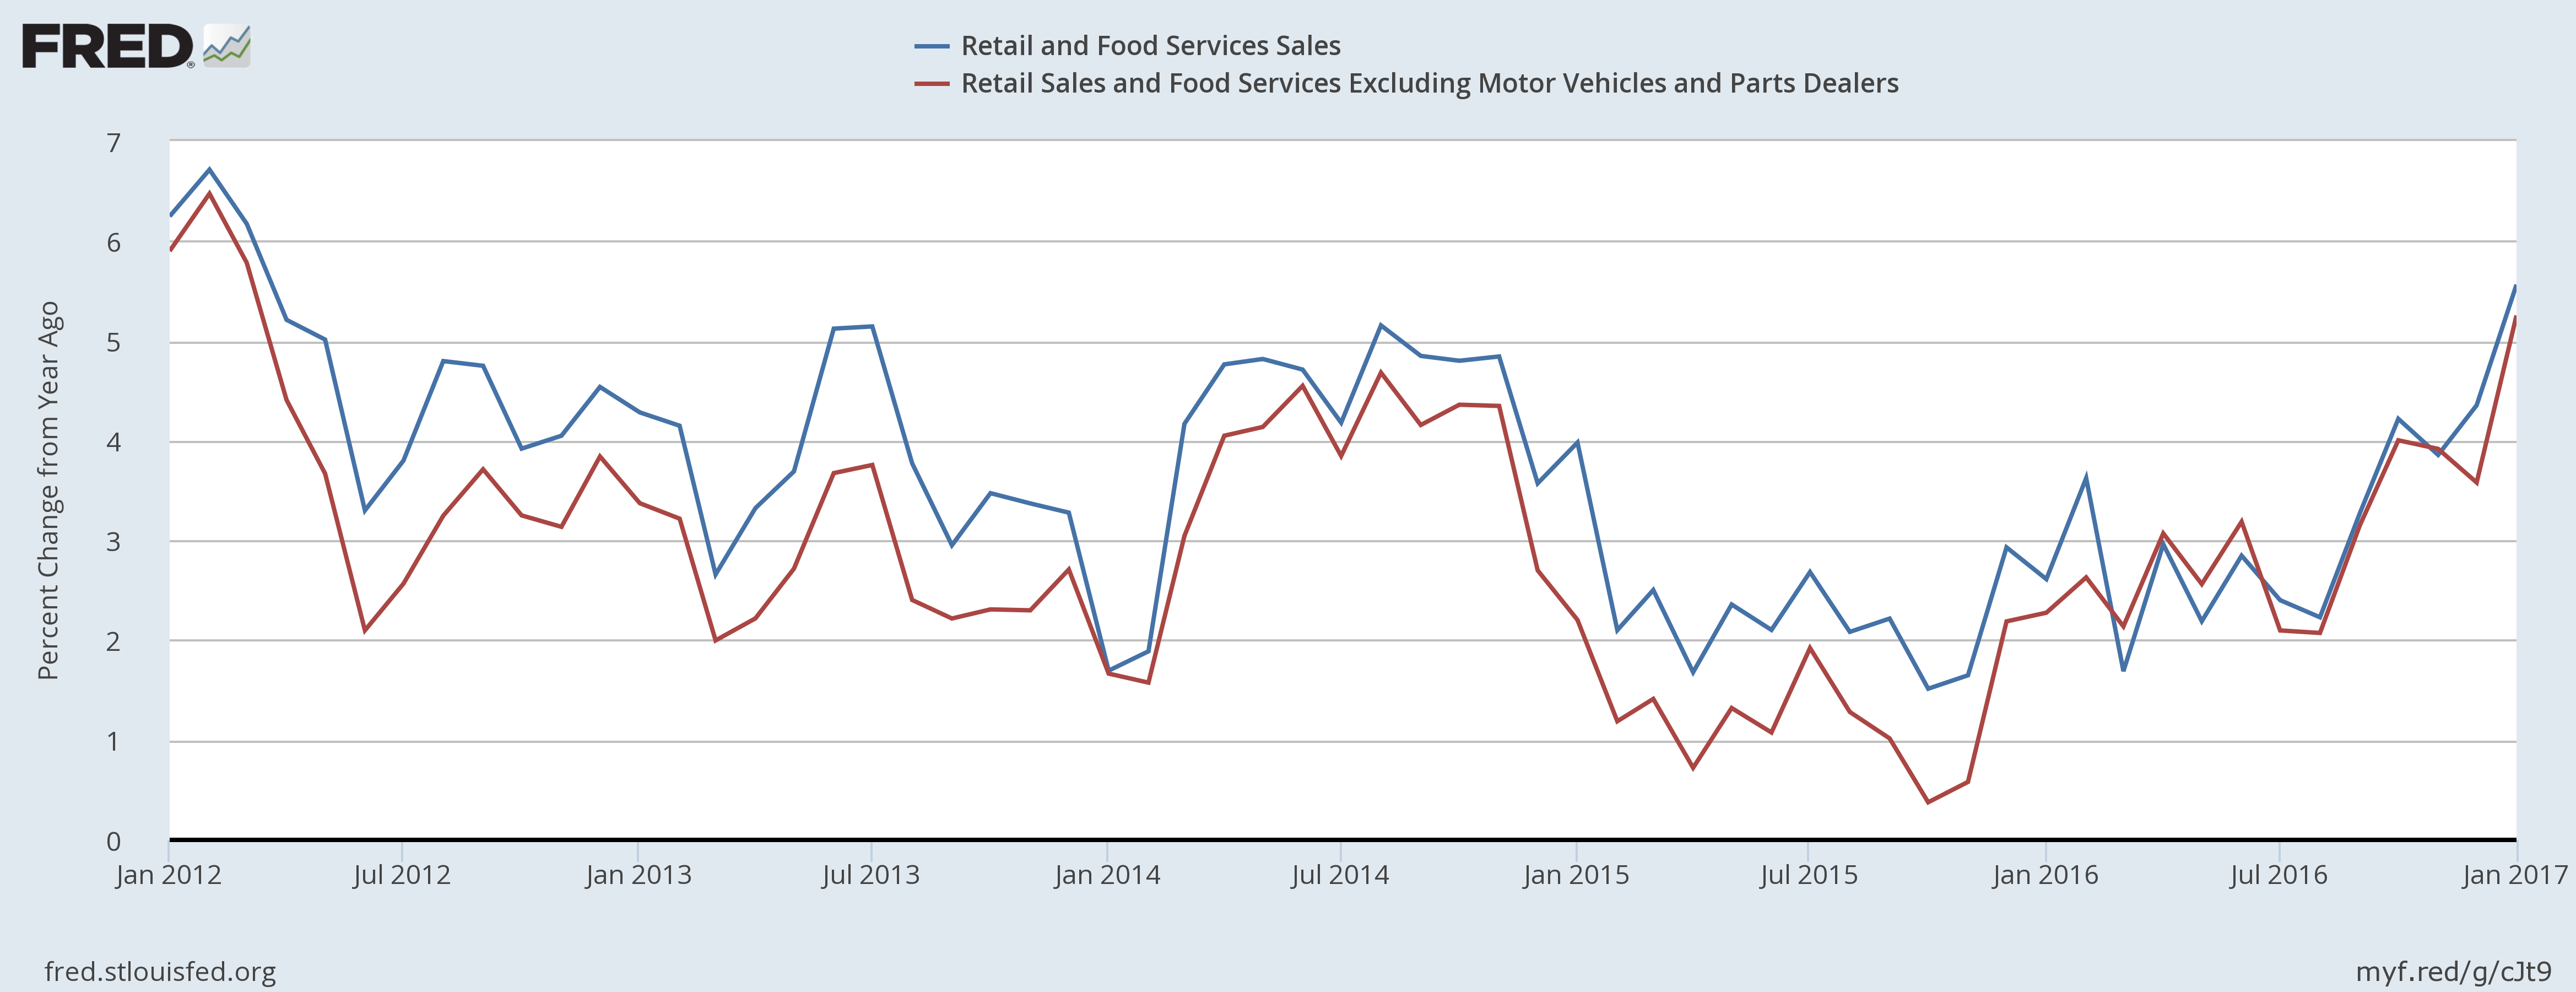
Notice that the overall trend has accelerated over the last 6 months, with the pace of Y/Y growth nearing a 5-year high.
Industrial production was down slightly, but, as is usual with this indicator, the devil is in the details:
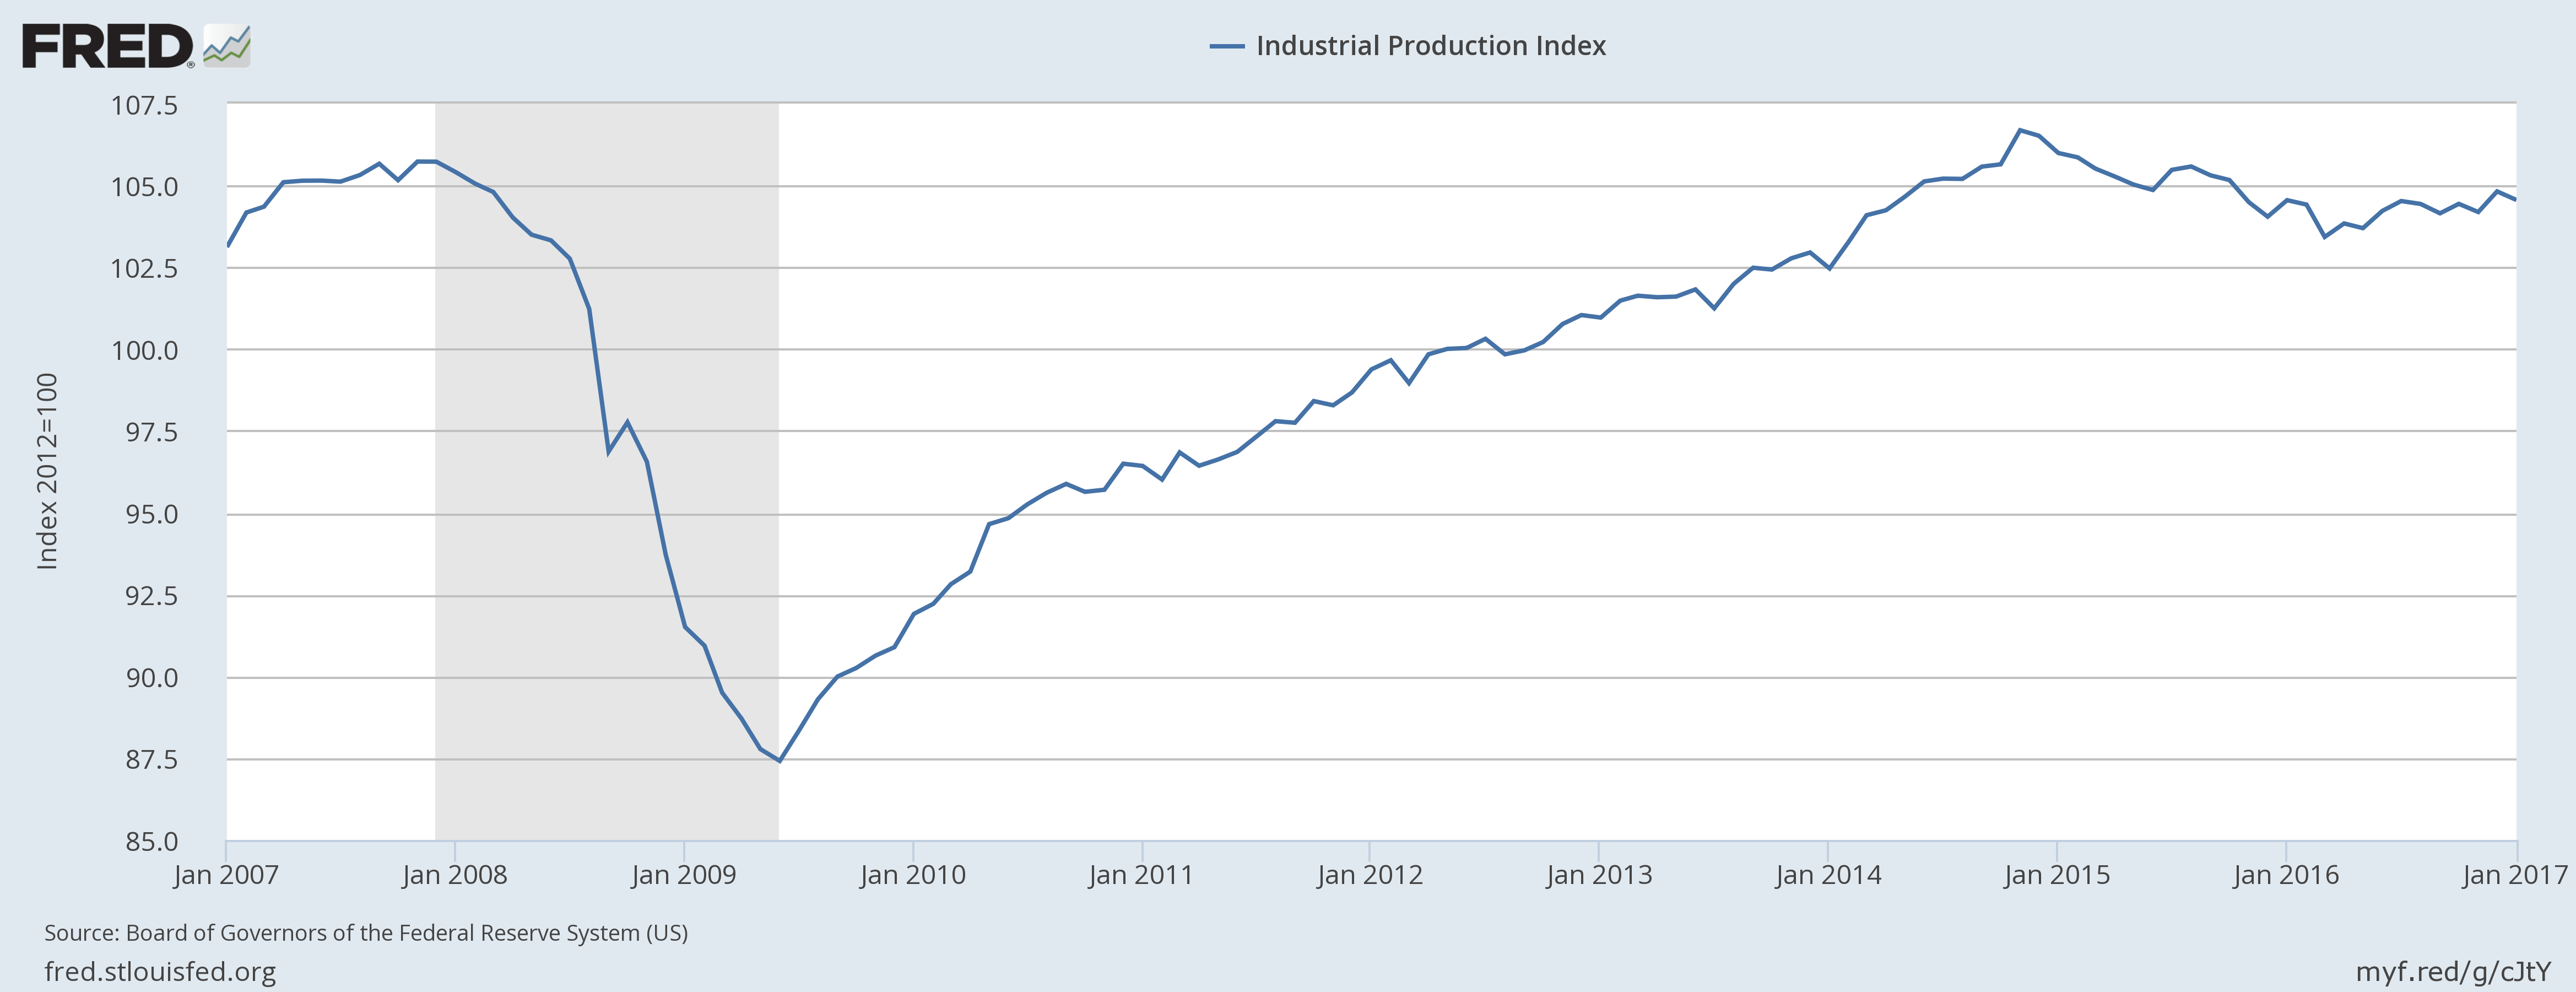
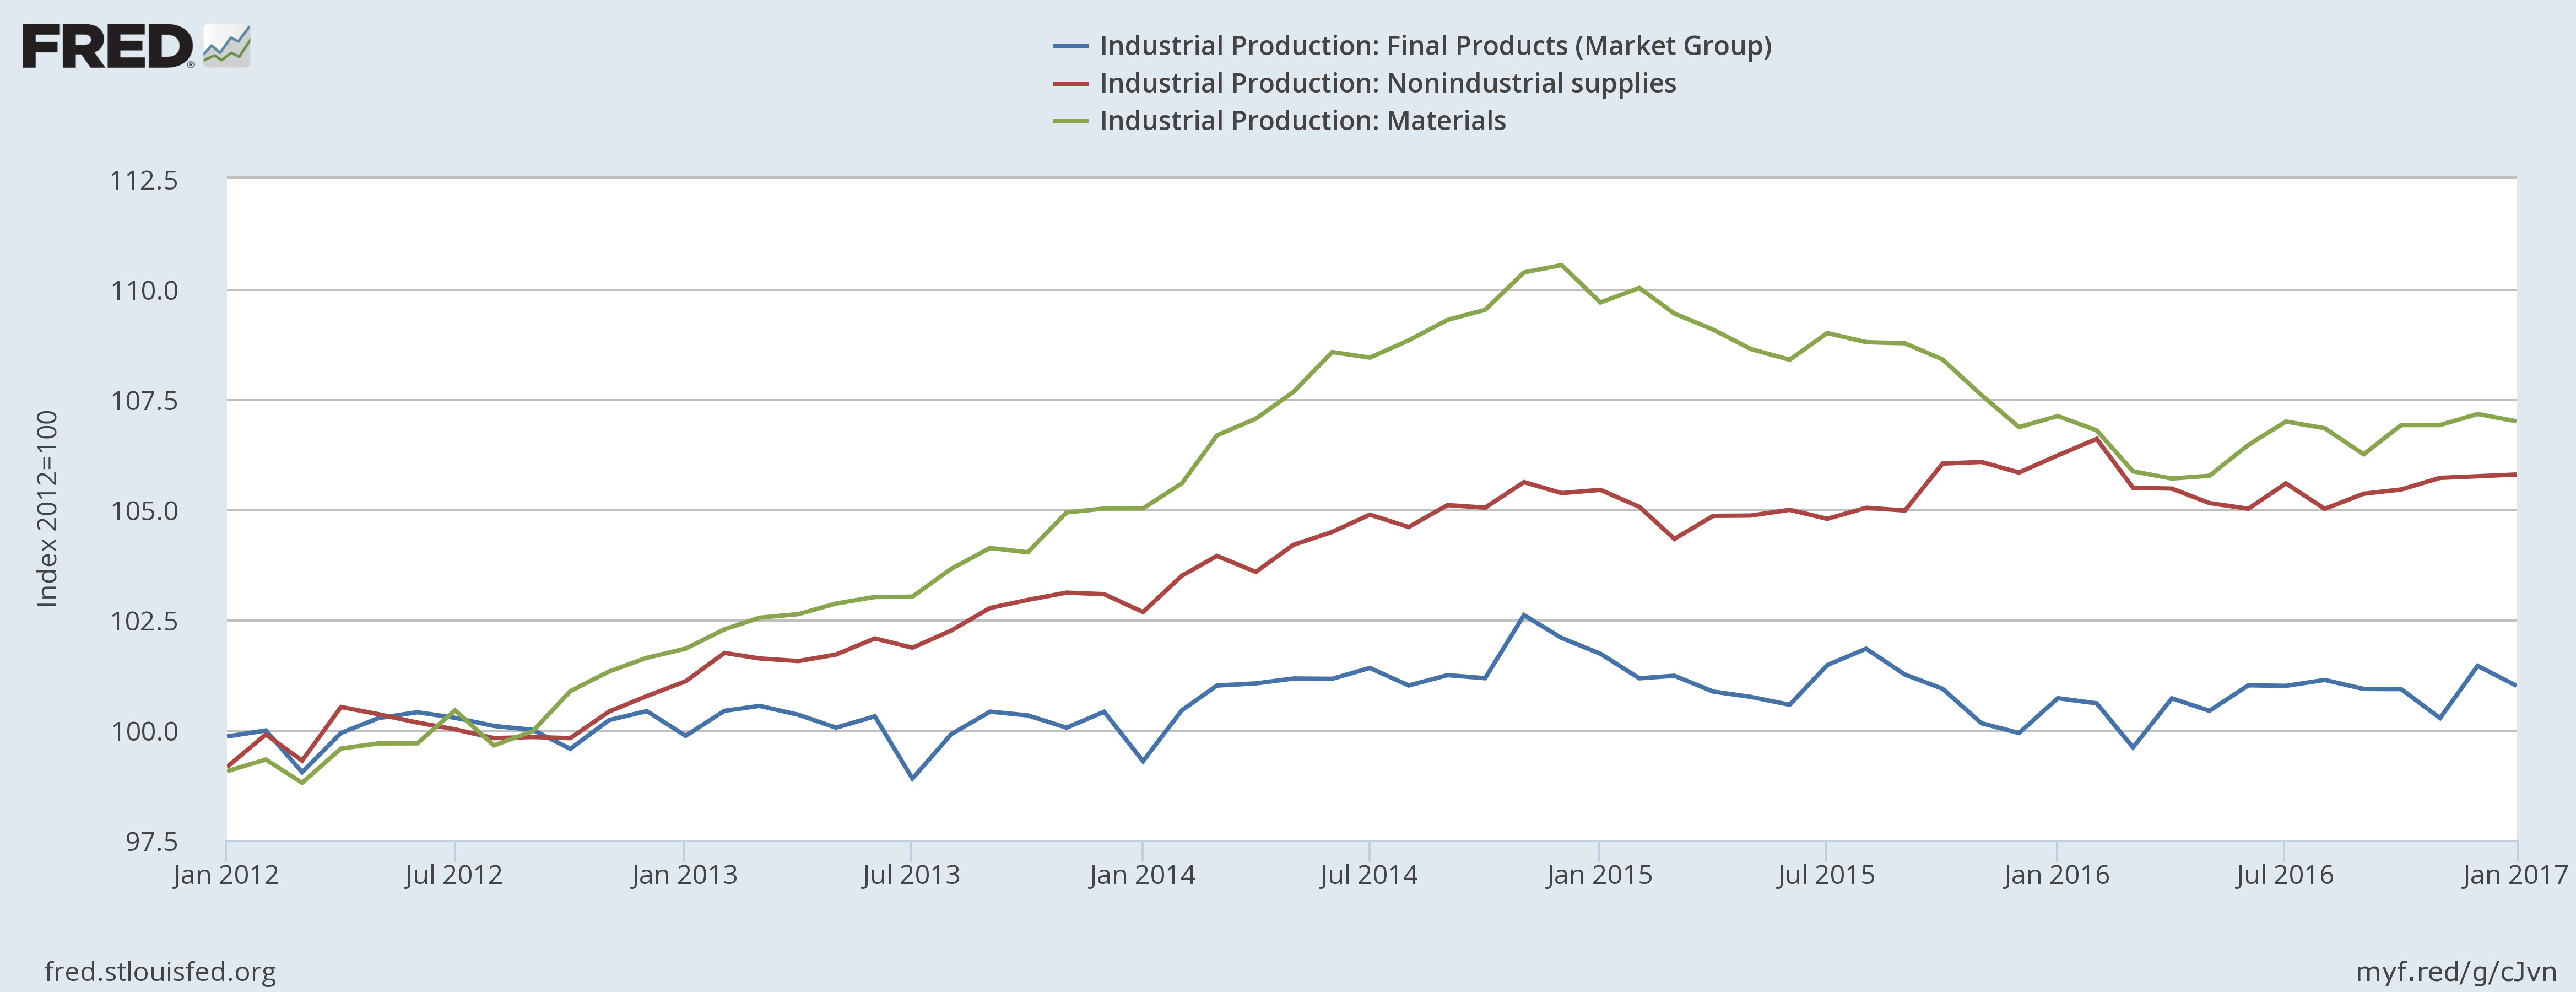
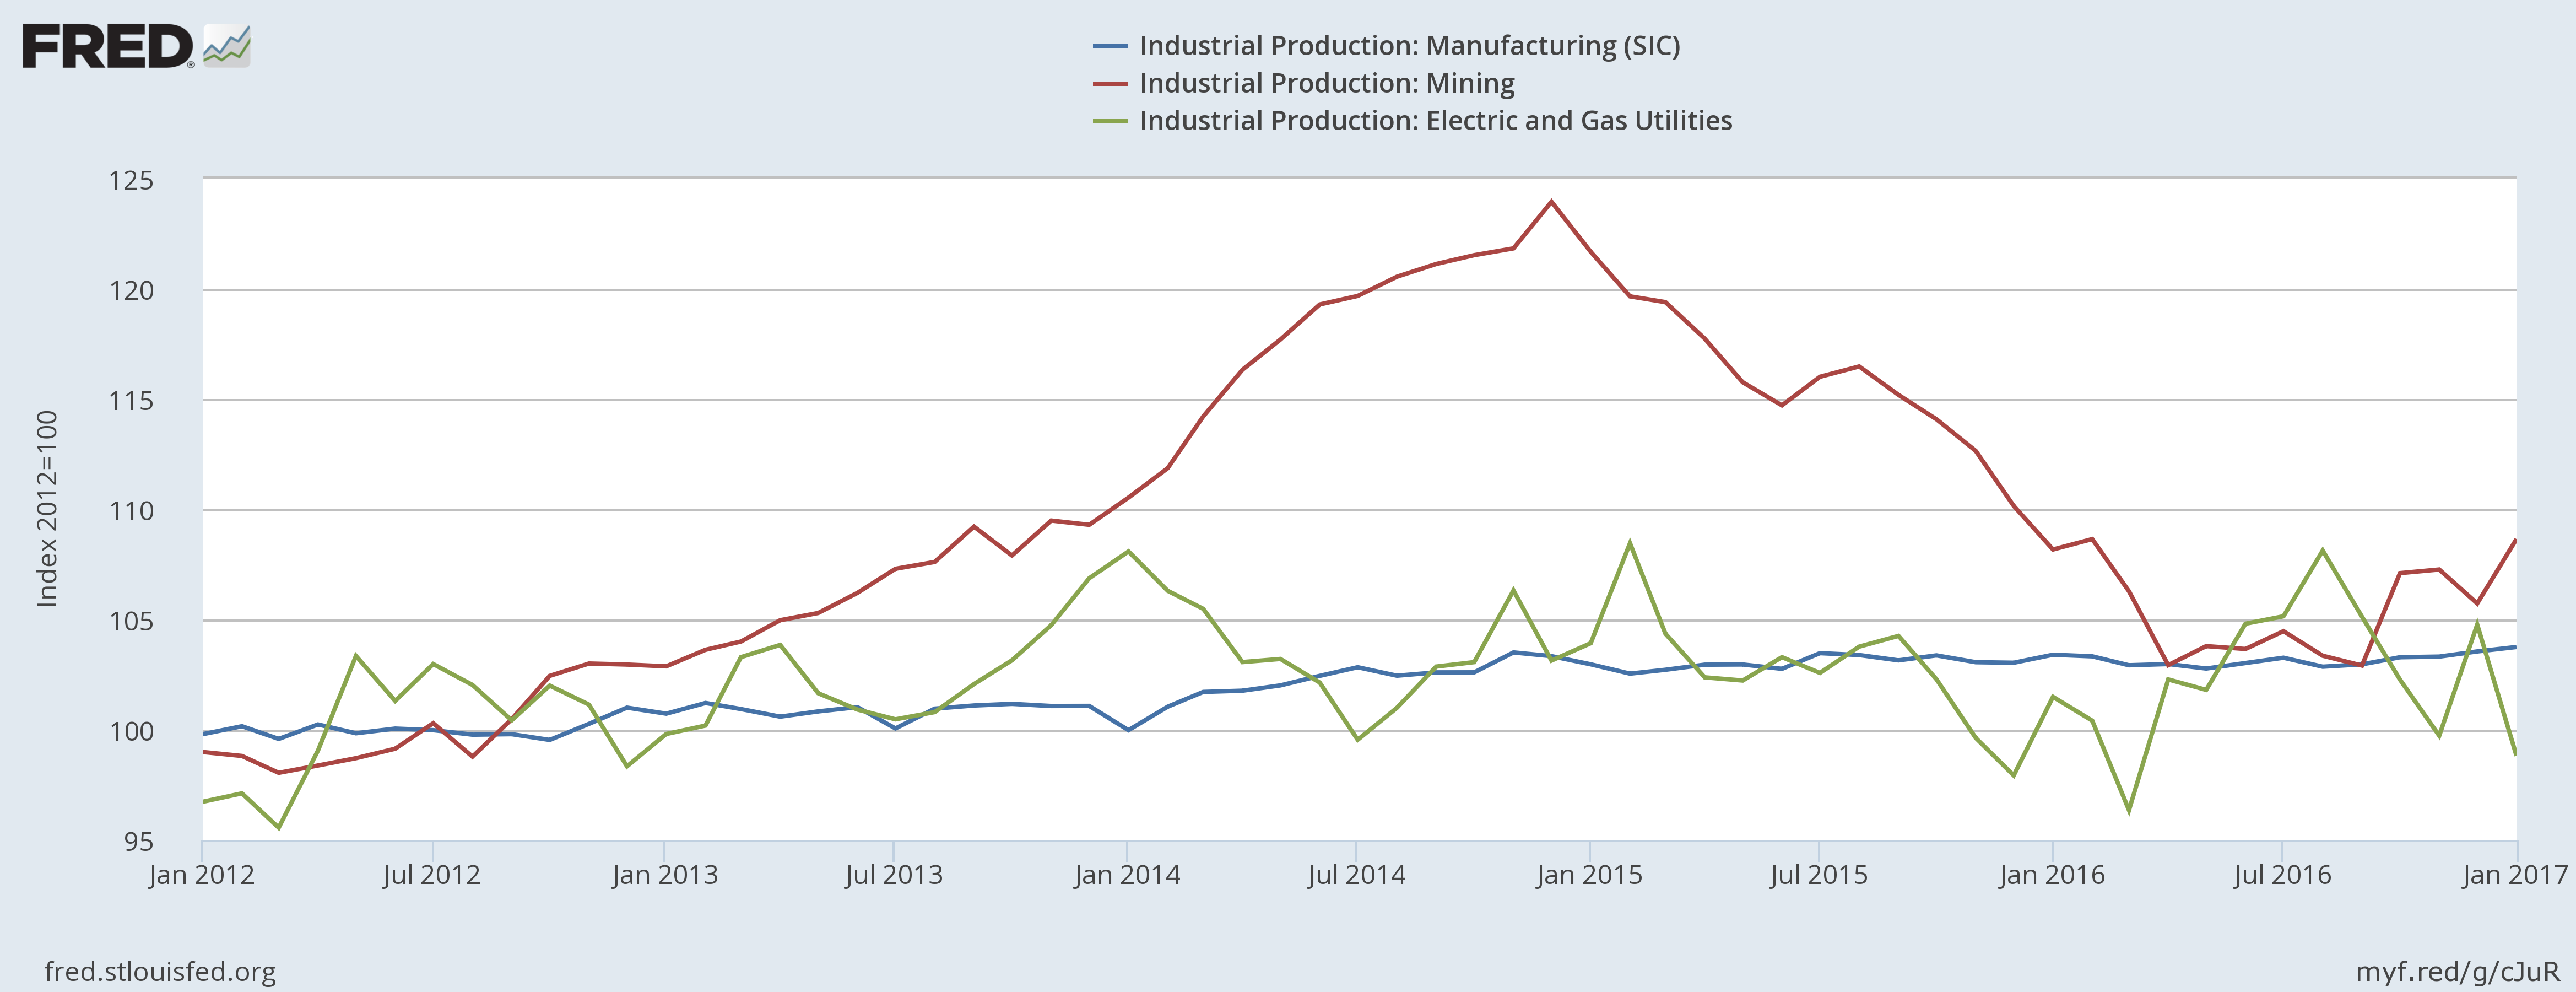
The top chart shows the overall trend, which fell at the beginning of 2015 thanks to a drop in oil prices. The series leveled off starting in 2016. The middle chart shows that all the major market groups have moved sideways since the beginning of 2016; also note that mining (in green) was the primary driver of pre-2016 growth. The bottom chart shows major industry groups. As with the market groups, mining is the main mover. Also note that the sharp drop in utilities (in green) was the main reason for last month’s decline.
Building permits increased:
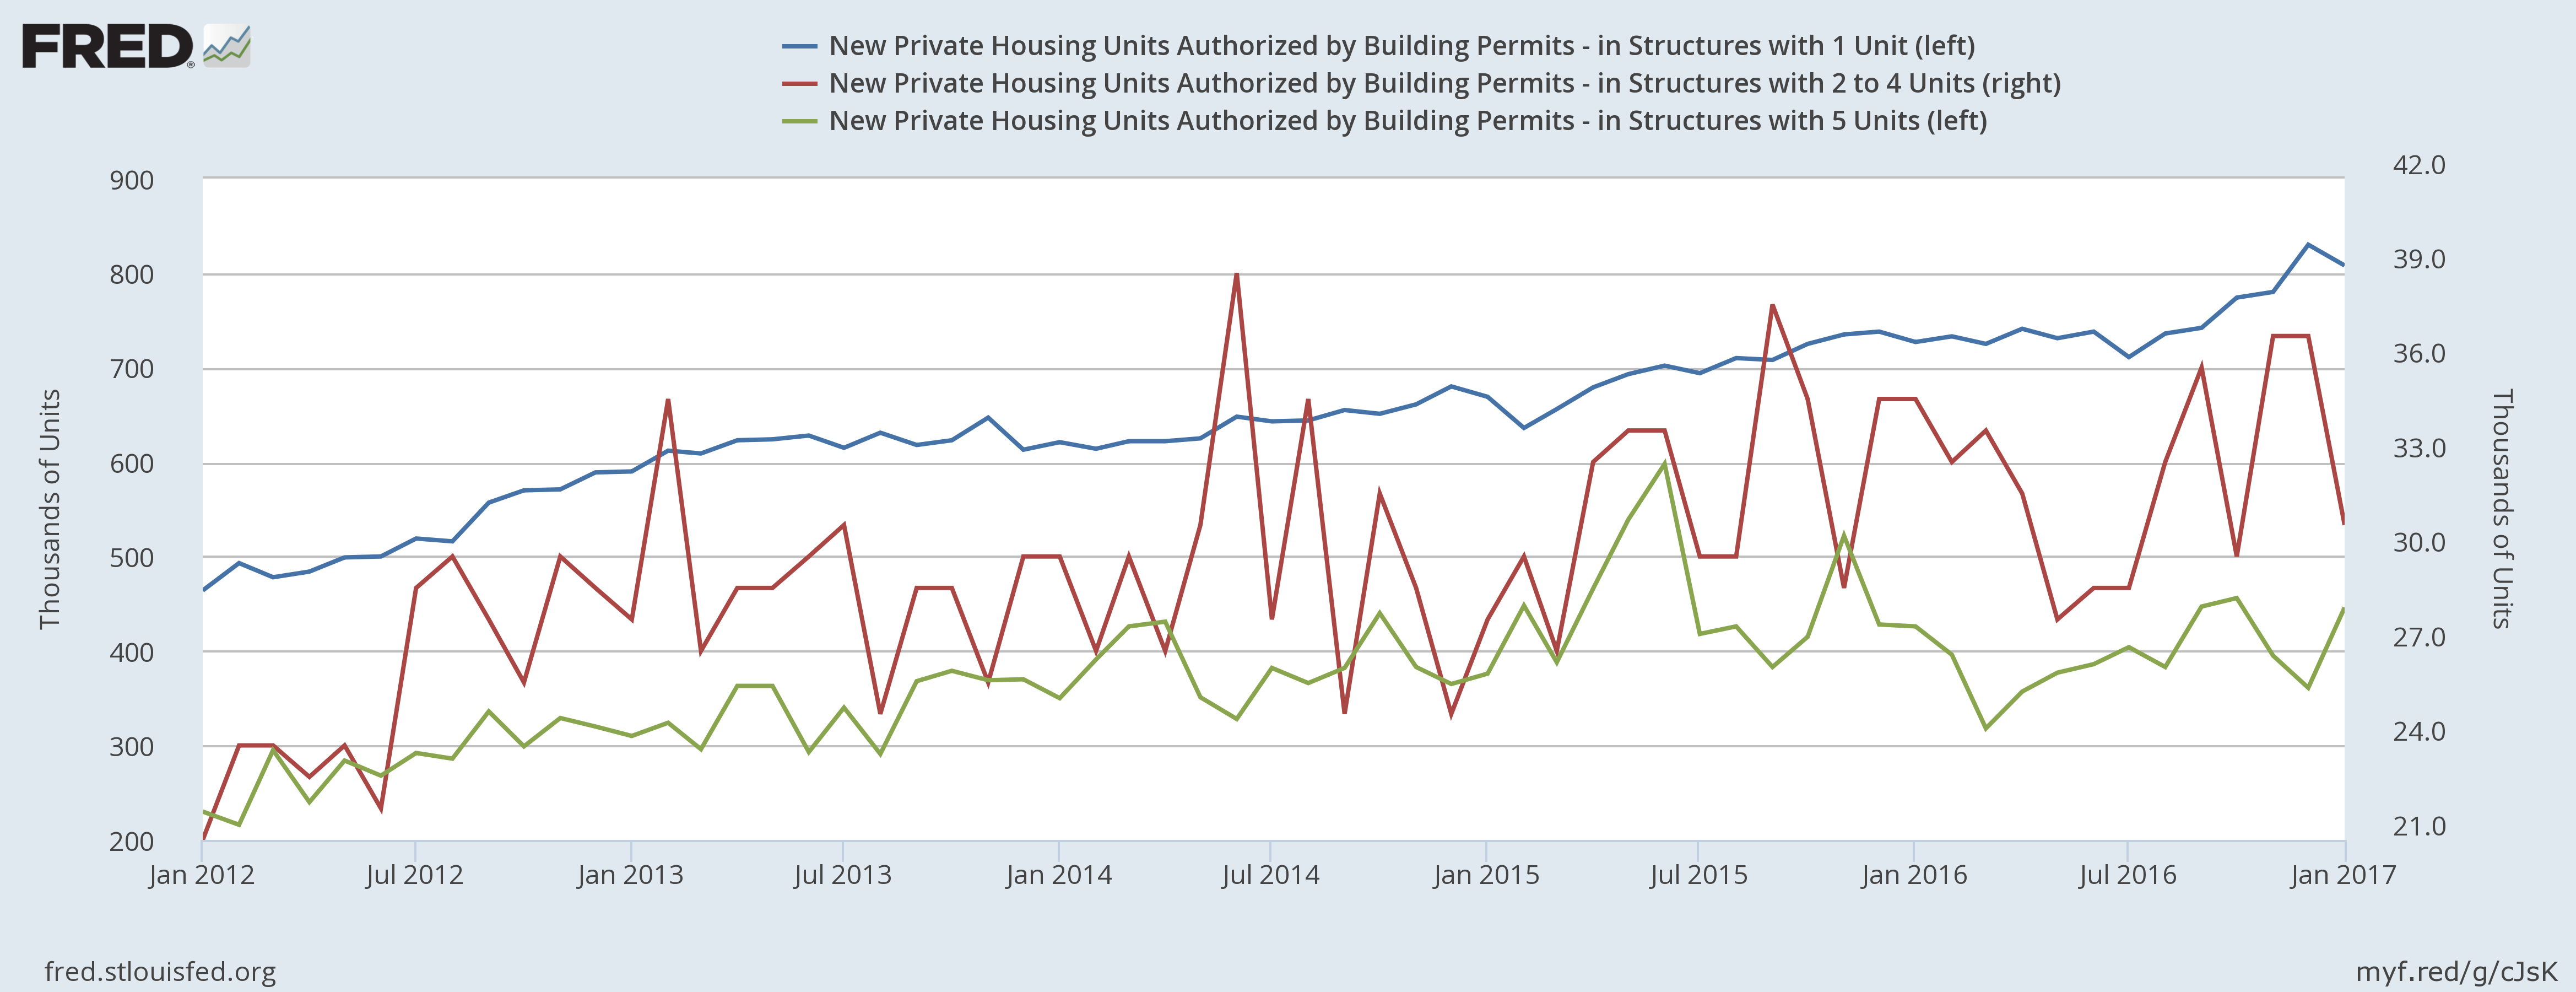
The top charts shows the overall trend for the series. The bottom chart breaks the down into three sub-groups. 1-unit structures (in blue) decreased slightly, 2-4 unit structures (in red) dropped sharply, while 5+ greater units (in green) increased.
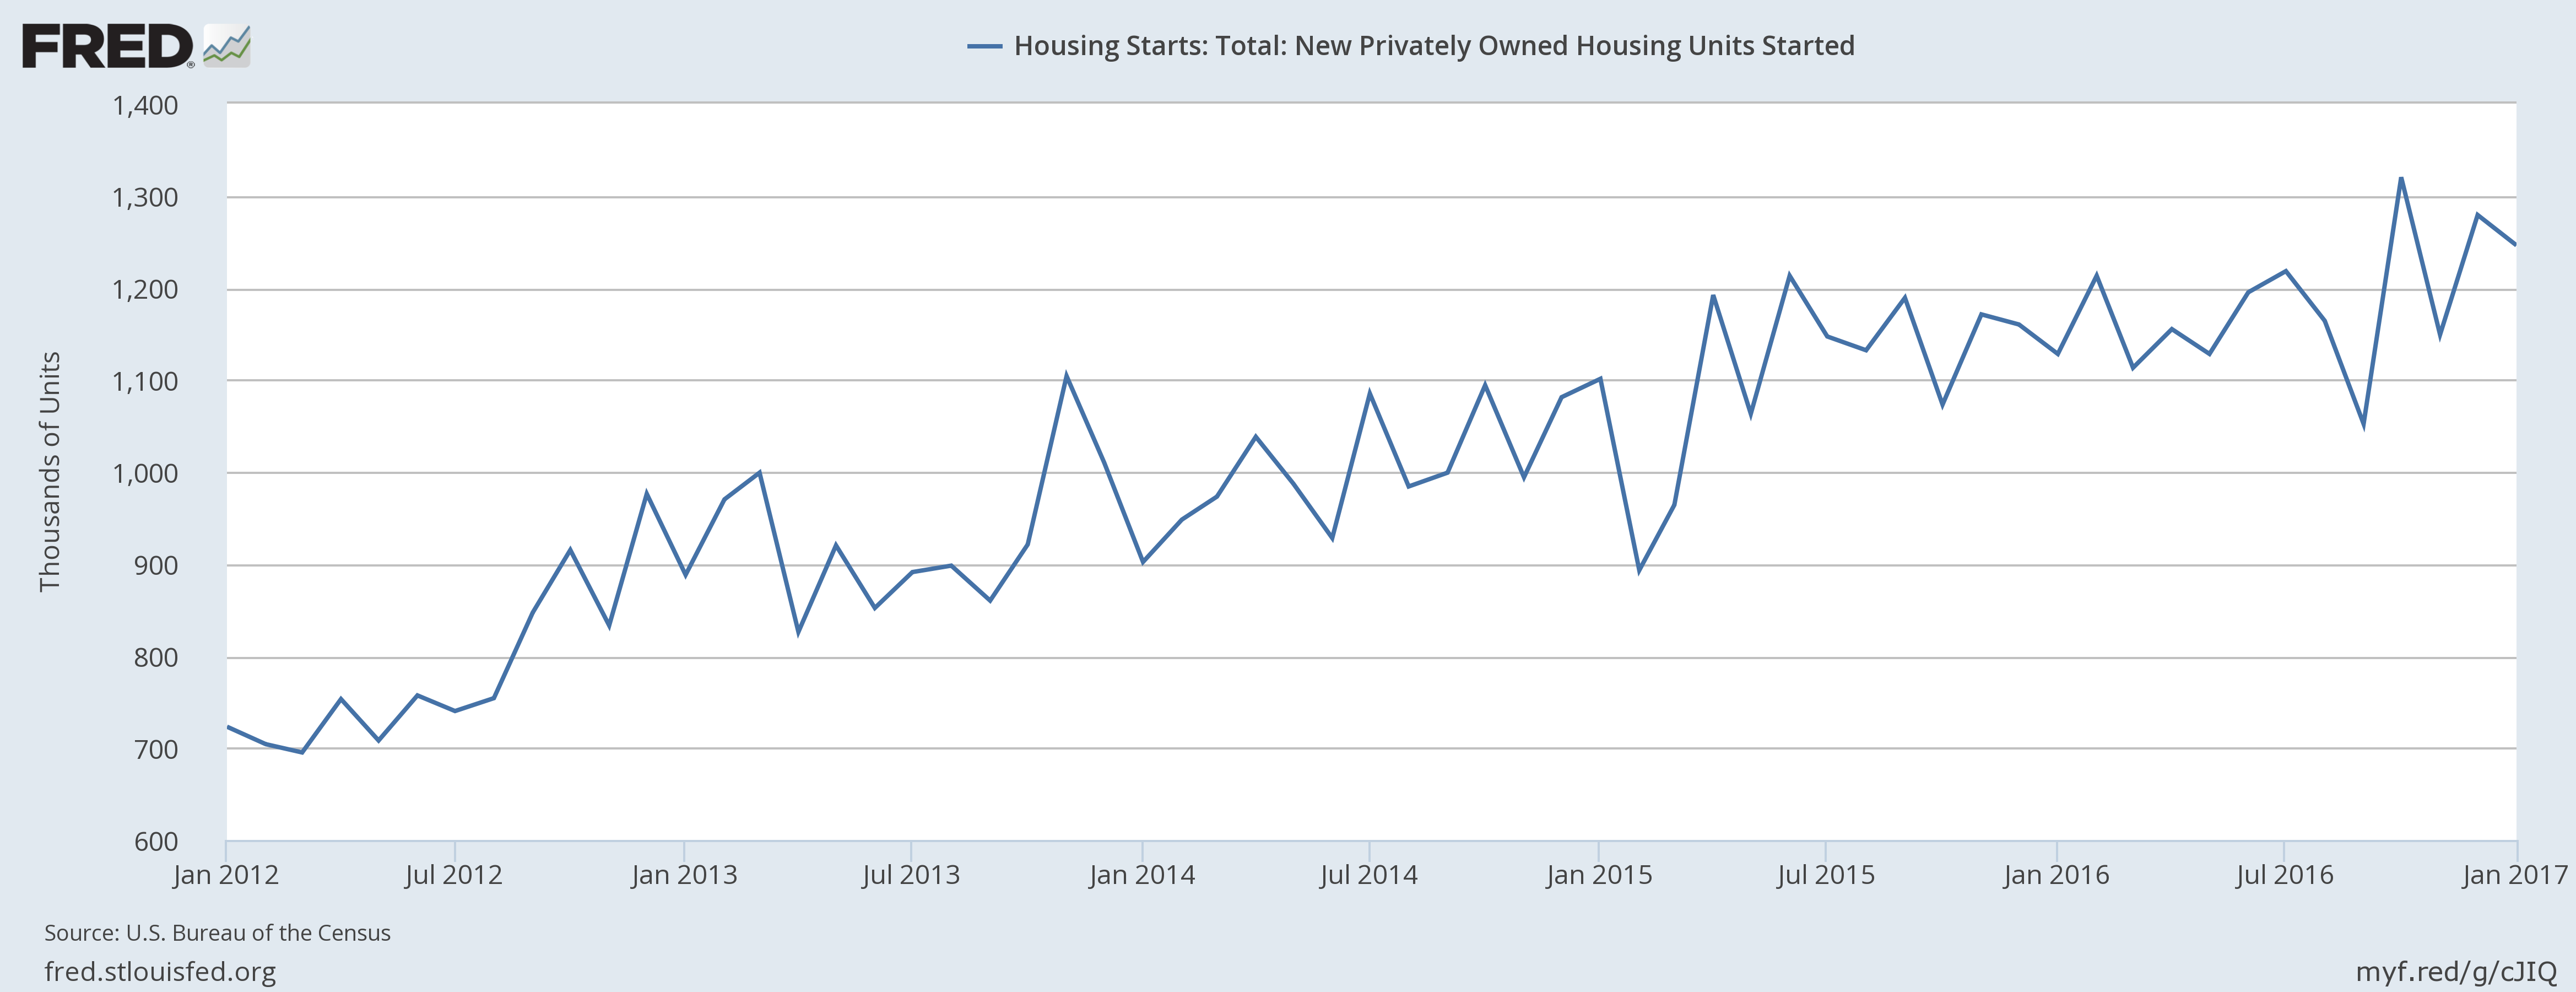
Meanwhile, although housing starts decreased slightly, the overall trend for the data series continues sideways:
The Atlanta Fed is predicting 1Q GDP growth of 2.4% while the NY Fed is forecasting 3.1%; the average of the two is 2.75%.
Economic Conclusion: this week's news was bullish. The consumer continues to spend, industrial production fell, but mainly due to alarge drop in utilities output and the housing market continues to expand. Put in economic indicator terminology, the long-leading indicators point to growth as to the coincident numbers.
Market Review: last week was a strong week for the market:
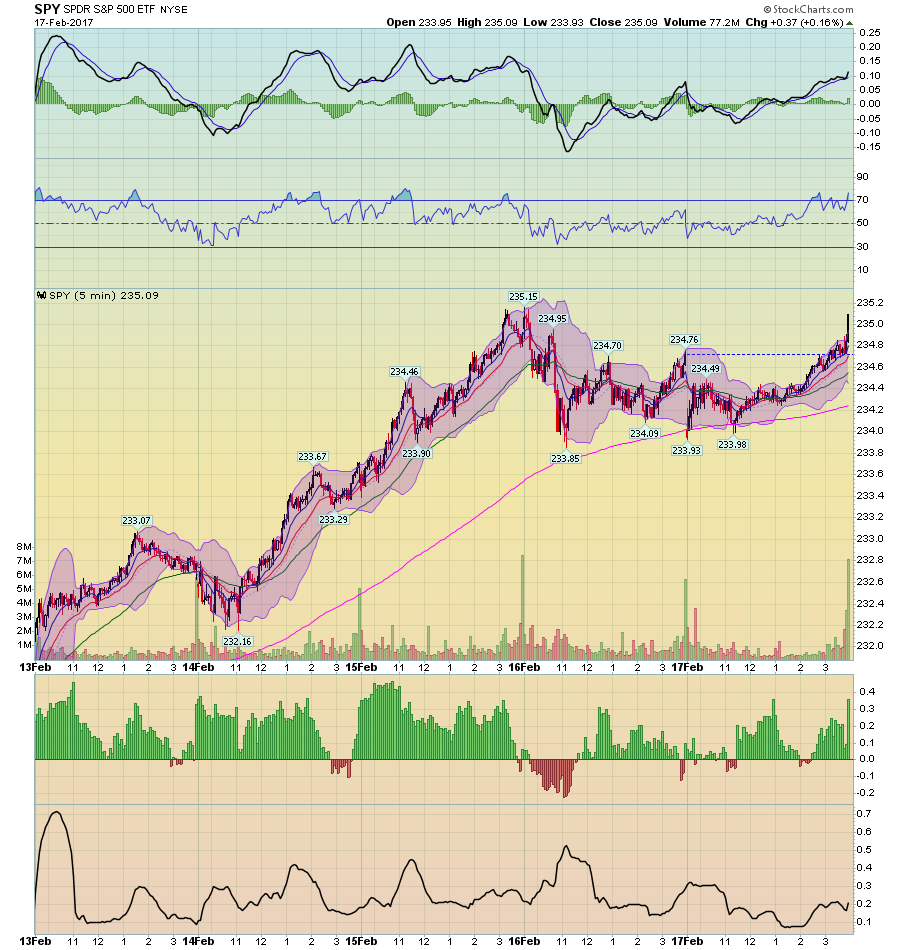
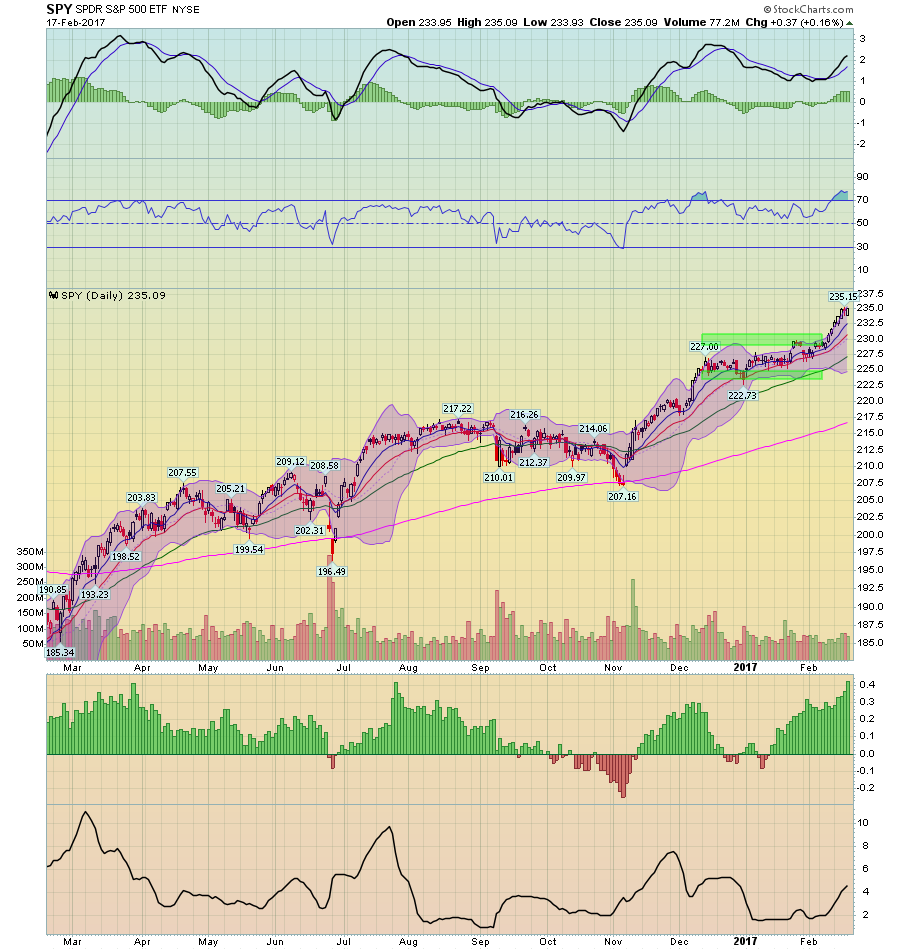
The 5-minute SPY (NYSE:SPY) chart is on top; it rallied in the first half of the week and then consolidated gains between 234-235 on Thursday and Friday. The bottom chart (a daily chart of the SPYs) places that development in a longer-term perspective. The markets consolidated their post-election rally between mid-December and early February. During this time, the MACD fell, giving the market more upside room, which it took advantage of over the last week.
The 4Q earnings season has added to the bullishness. From Zacks:
As of Wednesday, February 15th, we have seen Q4 results from 375 S&P 500 members or 75% of the index’s total membership. Total earnings for these 375 index members are up +7.2% on +4.6% higher revenues, with 68.8% beating EPS estimates and 54.4% coming ahead of top-line expectations. The proportion of companies beating both EPS and revenue estimates is 40%.
But the weekly chart looks stretched:
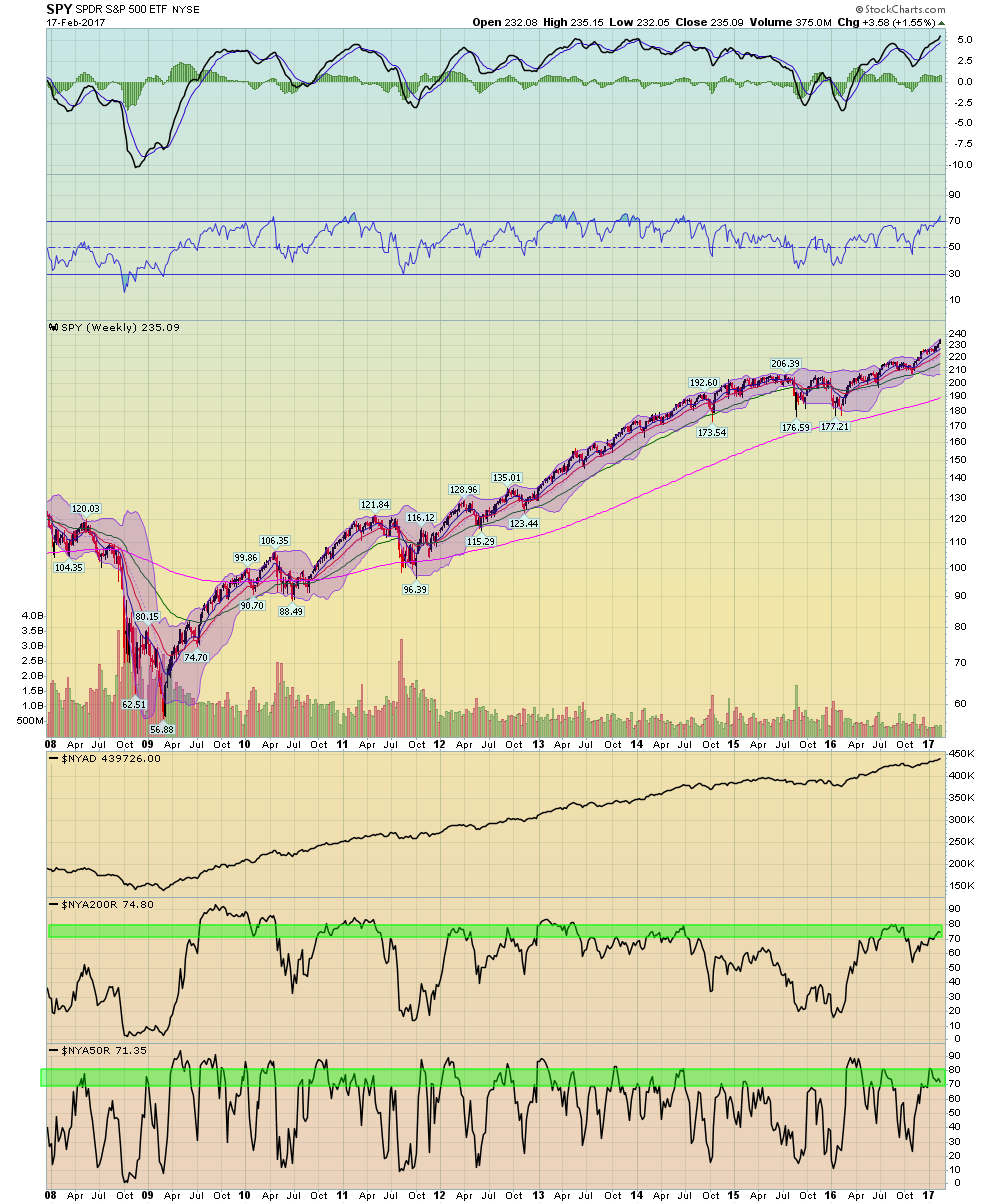
The weekly MACD (top panel) is near multi-year highs. The percentage of stocks above both the 50 and 200 day EMAs (the bottom 2 panel) is also bear multi-year highs. Also of importance is the lack of participation from the transports and Russell 2000. The latest SPY rally could simply be a rotation from smaller to larger stocks. Or there could declining confidence in small-caps, which would indicate waning optimism about the domestic economy. Adding to the bearish argument is that the markets are expensive (from the WSJ):

As has been the case for the last 12-18 months, there is plenty of fodder for bulls and bears. The bulls can argue that a solid earnings season, a growing domestic economy, increasing confidence and lack of recessionary pressure indicate the markets should move higher. The bears can point an already expensive market, the growing possibility of rate hikes, the declining possibility of meaningful policy action at the federal level and increasing inflationary pressure as signs of an already expensive market with little upside room.
