In the end it is not so much about “predicting” what will happen next in the financial markets, but rather recognizing – and being prepared for – the potential risks, that makes the most difference in the long run. So let’s start by looking at current trends.
Stocks
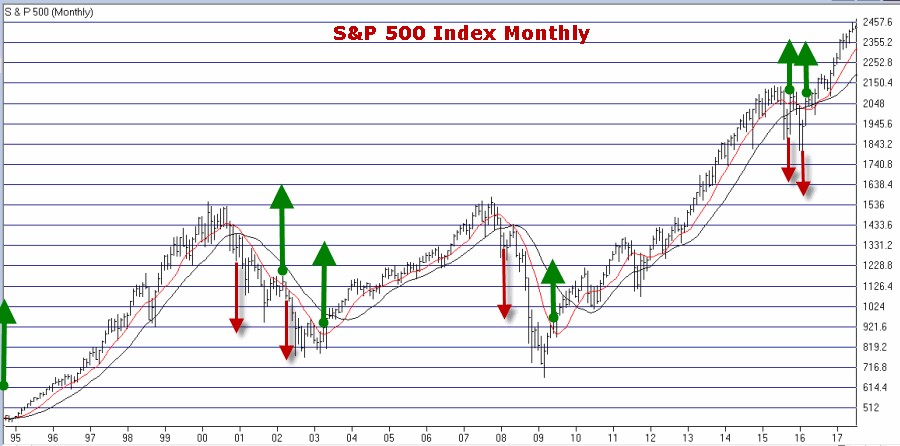
Let’s start with a most simple trend-following model that works like this:
-A sell signal occurs when the S&P 500 Index (SPX) registers two consecutive monthly closes below its 21-month moving average
-After a sell signal, a buy signal occurs when SPX register a single monthly close above its 10-month moving average.
Figure 1 displays recent activity.
Figure 1: Courtesy AIQ TradingExpert
The good news is that this model does a good job of being out of stocks during long bear markets (1973-74, 2000-2002, 2008-2009). The bad news is that – like any trend-following model – it gets “whipsawed” from time to time. In fact the two most recent signals resulted in missing out on the October 2015 and March 2016 rallies.
But note the use of the phrase “simple trend-following model” and the lack of phrases such as “precision market timing” and “you can’t lose trading the stock market”, etc.
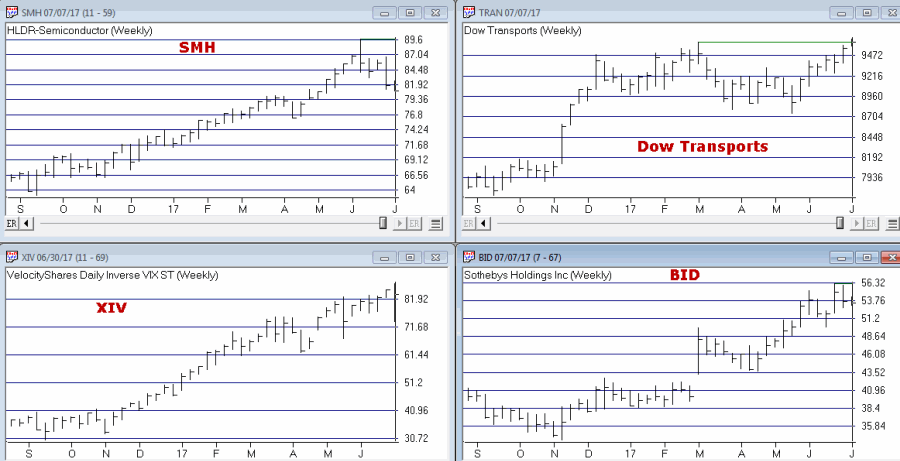
For now the trend is up. A few things to keep an eye on appear in Figures 2 and 3. Figure 2 displays four major averages. Keep an eye to see if these averages break out to the upside (see here) or if they move sideways to lower.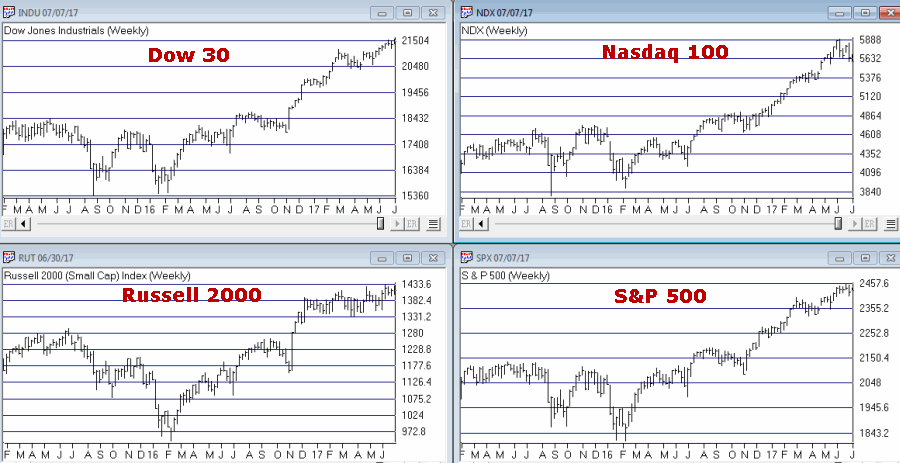
Figure 2: Courtesy AIQ TradingExpert
In addition, I suggest following the 4 tickers in Figure 3 for potential “early warnings” – i.e., if the major averages hit new highs that are not confirmed by the majority of the tickers in Figure 3.
Figure 3: Courtesy AIQ TradingExpert
Bonds
My main “simple bond trend-following model” remains bearish. As you can see in Figure 4, a buy signal for bonds occurs when the 5-week moving average for ticker iShares MSCI Japan (NYSE:EWJ) (Japanese stocks) drops below its 30-week moving average and vice versa.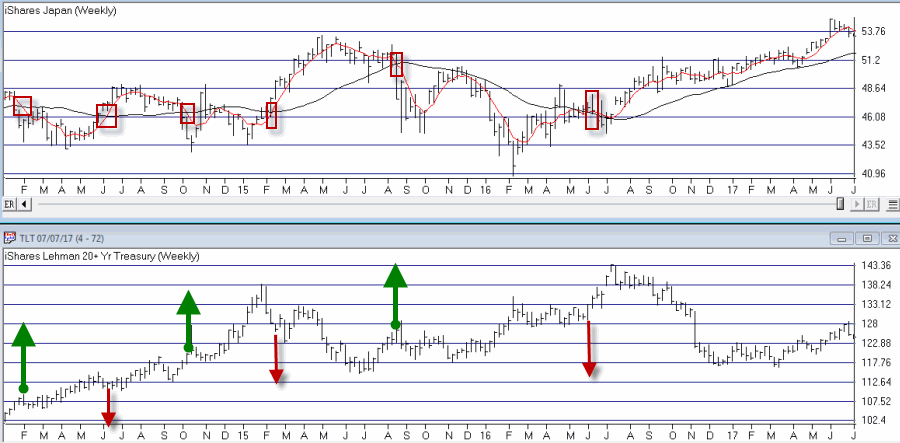
Figure 4 – Ticker EWJ 5-week and 30-week moving average versus ticker iShares 20+ Year Treasury Bond (NASDAQ:TLT), Courtesy AIQ TradingExpert
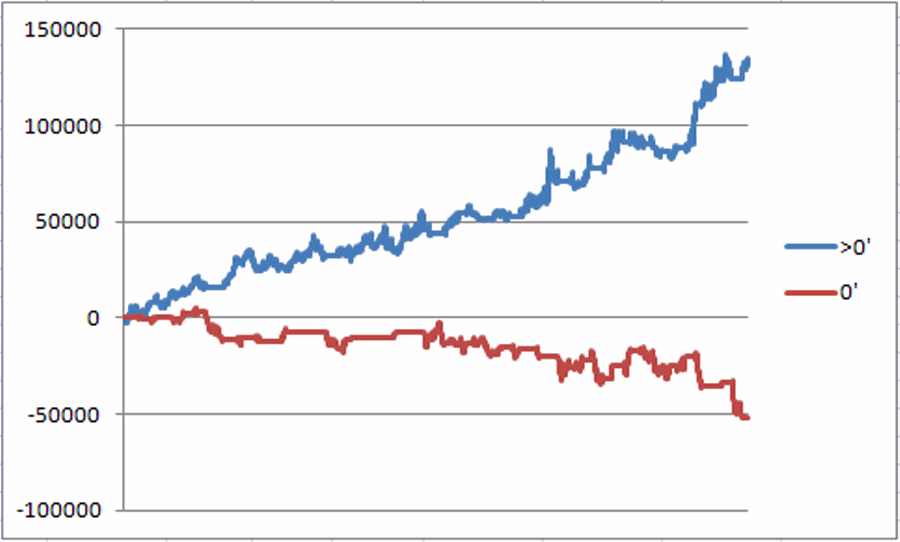
A 2nd model using metals to trade bonds has been bullish of late but is close to dropping back into bearish territory. Figure 5 displays the P/L from holding a long position of 1 t-bond futures contract ONLY when both the EWJ AND Metals models are bearish (red line) versus when EITHER model is bullish (blue line)
Figure 5 – T-bond futures $ gain/loss when iShares MSCI Japan (NYSE:EWJ) OR Metals Models are Bullish (blue line) versus when EWJ AND Metals Models are both Bearish (red line); August 1990-present
Gold
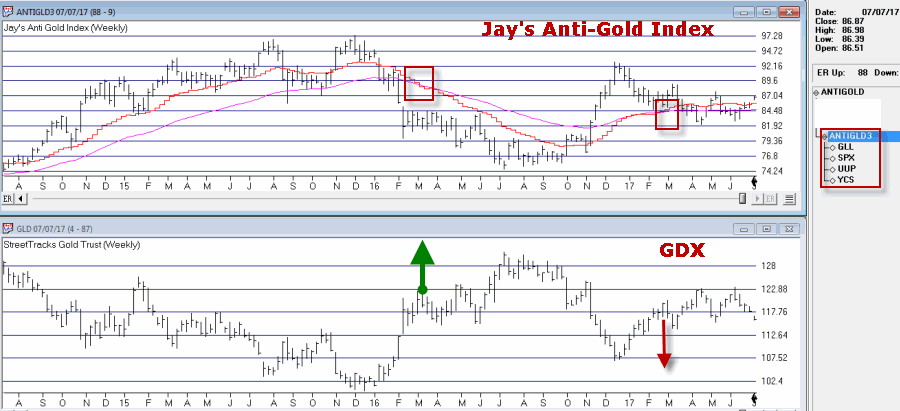
My most basic gold trend-following model is still bearish. This model uses my “Anti-Gold Index” (comprised of tickers ProShares UltraShort Gold (NYSE:GLL), S&P 500, PowerShares DB US Dollar Bullish (NYSE:UUP) and ProShares UltraShort Yen (NYSE:YCS)). It is bullish for gold when a Front-Weighted Moving Average (detailed here) is below the 55-week exponential moving average and vice versa.
Figure 6: Courtesy AIQ TradingExpert
Summary
So at the moment the stock model is bullish and the bond and gold models are bearish. Are these trends certain to persist ad infinitum into the future? Definitely not. Will the models detailed here provide timely signals regarding when to get in or out the next time around? Sorry, but it doesn’t always work that way with trend-following.
But as for me I prefer “riding the trend” to “predicting the future.”
Some painful lessons just stick with you I guess.

