For stock investors, the poor market performance to start the new year was not what market participants expected. Most readers have seen the statistic that the 5.96% decline in the S&P 500 Index so far this year is the worst market performance to begin a year on record. In an effort to keep things somewhat in perspective,
- since 1928 there have been 421 worse 5-day periods for the S&P 500 Index
- in August, the 5-day market decline was -11%.
Influencing investor perceptions is the fact not many asset class categories performed well last year. Except for the FANG stocks (Facebook (O:FB), Amazon (O:AMZN), Netflix (O:NFLX) and Google (O:GOOGL) (now called Alphabet)) diversifying one's investments across asset classes did not generate expected results and we commented on this in our last post of 2015. Coincident to the narrow market leadership has been the fact the S&P 500 Index has moved higher since the end of the financial crisis in a nearly uninterrupted climb. Until mid-year last year, the S&P 500 had gone nearly four years without a greater than 10% market correction.
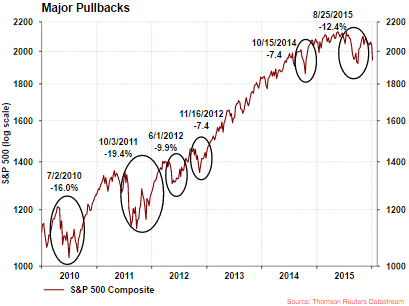
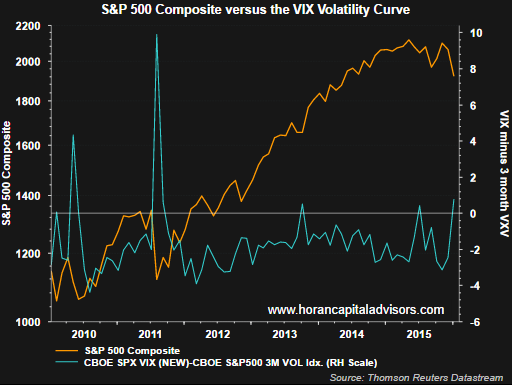
Prior to the last correction in August, two back to back sizable declines occurred in 2010 and 2011. One factor evident subsequent to 2011 was the lower volatility exhibited by the market, i.e., lower daily price swings in the market. This is seen in the chart below. The two circles on the chart mark the period around the time of the 2010 and 2011 corrections.
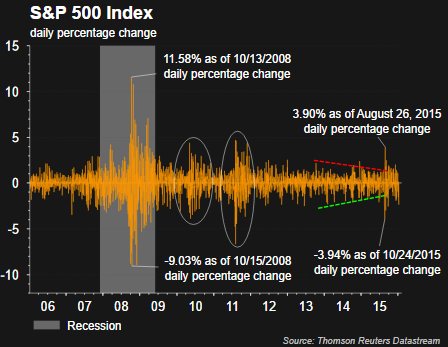
One theme we believe will play out over the course of this year is a market that has a more normal , that is, higher level of volatility on a daily basis. The start of this year is proving this to be the case.
There are several factors at play that are likely to be a catalyst for the higher level of market swings. The first and probably most significant one is the late stage of this economic expansion with our belief the economy is in the early last third of the cycle. This raises the question of how late in the cycle is the economy. At issue is the divergence in the ISM manufacturing and non-manufacturing indexes.
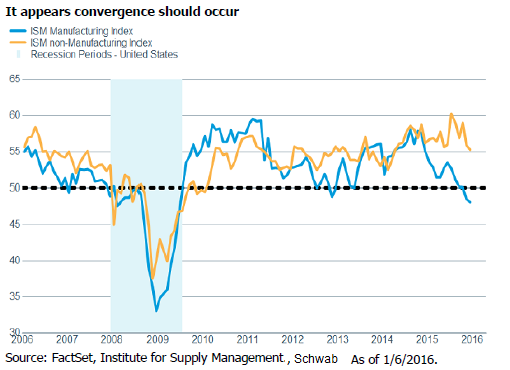
The ISM Manufacturing Index has fallen below 50 and is evidence of contraction in the manufacturing segment of the economy. According to the report, "contraction in new orders, production, employment and raw materials inventories accounted for the overall softness in December." In reviewing some of the respondents comments in the report, many of them referenced weakness in energy and commodities as an issue.
With respect to the ISM Non-Manufacturing Index, Charles Schwab (N:SCHW) notes, "With the service sector making up roughly 88% of the U.S. economy according to HFE Research, the easy answer is that the manufacturing sector (the other 12%) will be dragged along. But the cautionary tale is that the manufacturing side of the economy in the past has been a leading indicator; so we do not have blinders on to the risk of a recession if services were to falter. But the consumer-oriented services sector does generally benefit from lower energy prices; while the hit to the energy sector would lessen if oil prices were to stabilize." We also believe the consumer is in good financial shape and will benefit from their improved balance sheets and the benefit derived from lower energy costs.
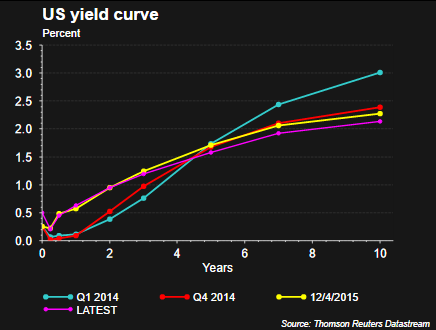
The second factor is the Fed. In December the Fed increased the Fed Funds rate by .25% or 25 basis points. Historically, when the Fed embarks on a tightening cycle, the market stumbles at the first rate hike. A rate increase from this low of an interest rate level historically does not hinder economic growth. The uncertainty with this rate tightening cycle is the fact economic growth since the financial crisis has been highly supported by quantitative easing activities. Subsequent to the Fed rate increase, the yield curve has actually begun to flatten with longer term rates declining in spite of an increase in short term rates.
So where does this lead us with respect to the equity markets? As a backdrop,
- 240 stocks in the S&P 500 Index are down more than 20% from their 52 week high
- another 160 stocks are down between 10-20% from their 52 week high
- in other words 80% of S&P 500 stocks are down greater than 10% from their 52 week high
- the market is down 9.6% compared to the high reached in May 2015
- if the market falls just 2.8% it will reach the low of August 25th (1,867)
From a technical and sentiment perspective the market is certainly approaching, if not near, oversold levels. With Friday's market close, the VX futures curve went into backwardation. This occurred near the market bottom on August 22, 2015. VIX backwardation is an indication traders expect volatility in the future to be lower than it is now. Historically, when this occurs, short term market rallies tend to result from this technical event.
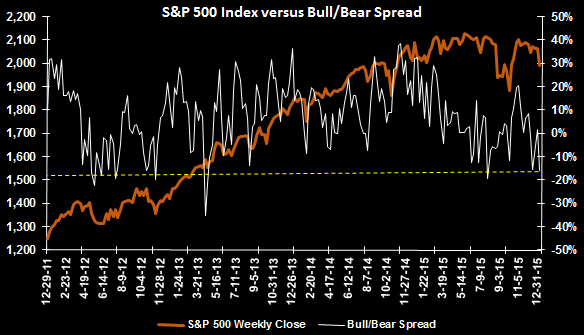
The American Association of Individual Investors' report last week showed, in addition to a decline in bullish sentiment to a level last reached in July 2015, the bull/bear spread came in at -16.1% versus the prior week's level of +1.5%. This week's reading is the most bearish the spread has been since July of 2015 as well.
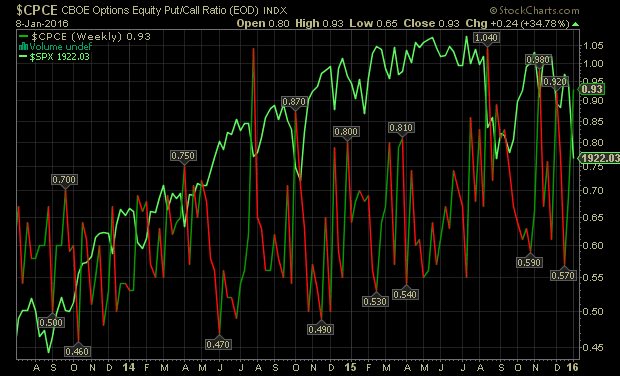
The equity put/call ratio spiked higher to .93 on Friday. This ratio measures the sentiment of investors by dividing put volume by call volume. At the extremes, this particular measure is a contrarian one; hence, P/C ratios above 1.0 signal overly bearish sentiment by investors. Levels above 1.0 are most associated with an oversold equity market.
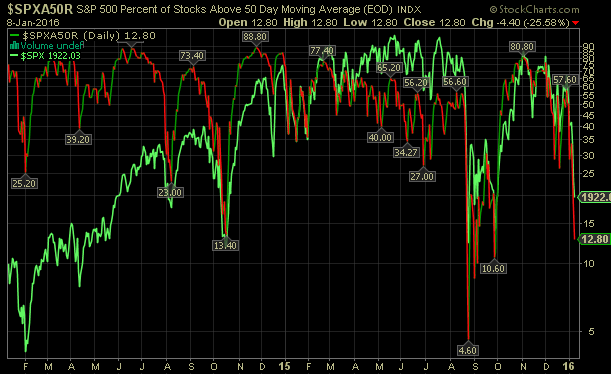
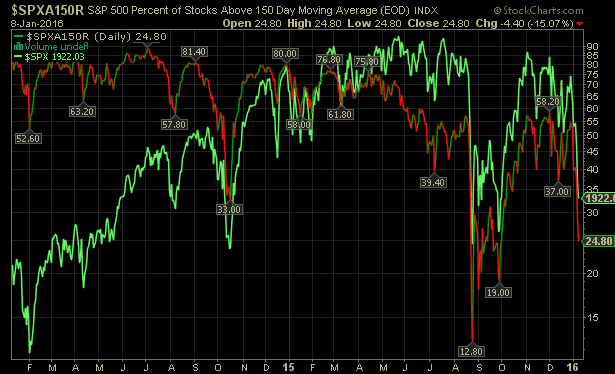
The next two charts show the percentage of S&P 500 stocks trading above their 50 and 200 day moving averages. Both charts show the low percentages occur near market levels which have historically been indicative of market bottoms.
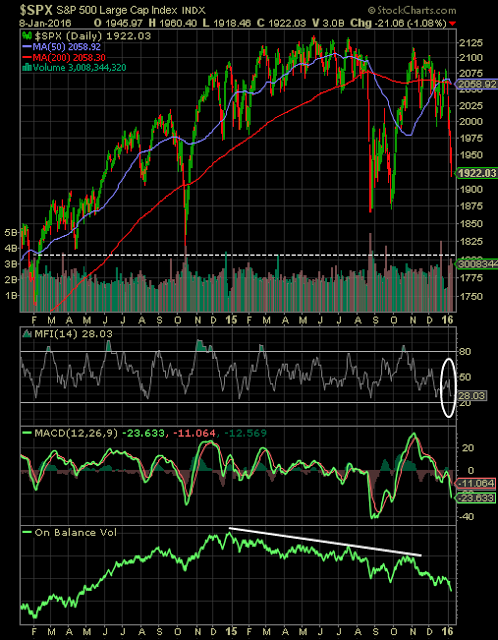
Lastly, a look at the market itself. In addition to the above noted technical and sentiment indicators, the below chart shows the market is nearing an oversold level. The technical money flow index (MFI) is nearing the oversold level, less than 20. The caveat is strong market downtrends can result in the MFI remaining below 20 for an extended period of time. The current MFI level is near the level reached at the August market low. On the other hand, both the MACD and On Balance Volume indicators are not indicating a market ready to bounce. For a number of other reasons also, but these two indicators may indicate the market retests the low reached in August, i.e., S&P 500 Index level 1,867. As noted at the outset of this post, to reach the August low, the market would need to decline only 55 points or 2.8% from Friday's close.
In summary, Burt White, Chief Investment Officer at LPL Research, provided good commentary for investors as they navigate this market environment.
"Risks remain, however, as continued declines in energy prices have delayed vital capital investment by a major segment of the U.S. economy, corporate earnings remain muted, and manufacturing remains weighed down by tepid global demand and a stronger dollar. Although the turmoil in the oil markets remains a top concern, the lower prices should help speed up the painful supply adjustment process and may bring about greater stability as the year unfolds. Should the supply-demand imbalance in energy stabilize as we expect, this could be a potential catalyst for additional capital spending and accelerated profit growth as 2016 progresses."
"Volatility has always been a part of investing and always will be. In fact, over the last 15 years, every calendar year has seen at least one pullback of at least 6% and a median correction of 14%. So while volatility is normal (and even expected), it is always nerve-wracking. These short-term market flare-ups are often quick and severe, but fueled by feelings of fear and concern over perceived risks that may not be actual threats. We expect volatility to remain heightened for the remainder of 2016, which is common as the business cycle ages, and in turn, makes sticking to your long-term investment plans even more important to avoid locking in losses and missing out on opportunities. This current pullback...could continue over the short term as fear and concern trump much of the good news coming from the U.S. economy. What remains as the key to weathering these short-term bouts of volatility is a commitment to a well-formulated plan, a long-term focus, and good headphones to tune out the noise of short-term negativity."
