
A number of organizations expect a reduction in the world surplus of platinum. Will the prices of this precious metal rise?
World Platinum Investment Council forecasts a decrease in the world surplus of platinum to 180 thousand ounces in the current year compared to the surplus of 315 million ounces in 2017. The world production may be reduced by 2% to 6.035 million ounces. Analytical agency Metals Focus expects a more significant reduction in the platinum surplus in 2018 to 40 thousand ounces. The demand for platinum in the automotive industry may decrease amid the Volkswagen (DE:VOWG_p) diesel emissions scandal. However, the overall global demand is expected to increase slightly due to the more active use of platinum in other industries, including chemistry. The price of platinum is significantly lagging behind gold. Last year, platinum prices increased by 1%, and gold prices - by 13%. Since early 2018, platinum prices have fallen by 1%, and gold prices have increased by the same percentage. In general, political tensions in Syria and disagreements between Iran and Israel can contribute to the growth of precious metals prices.
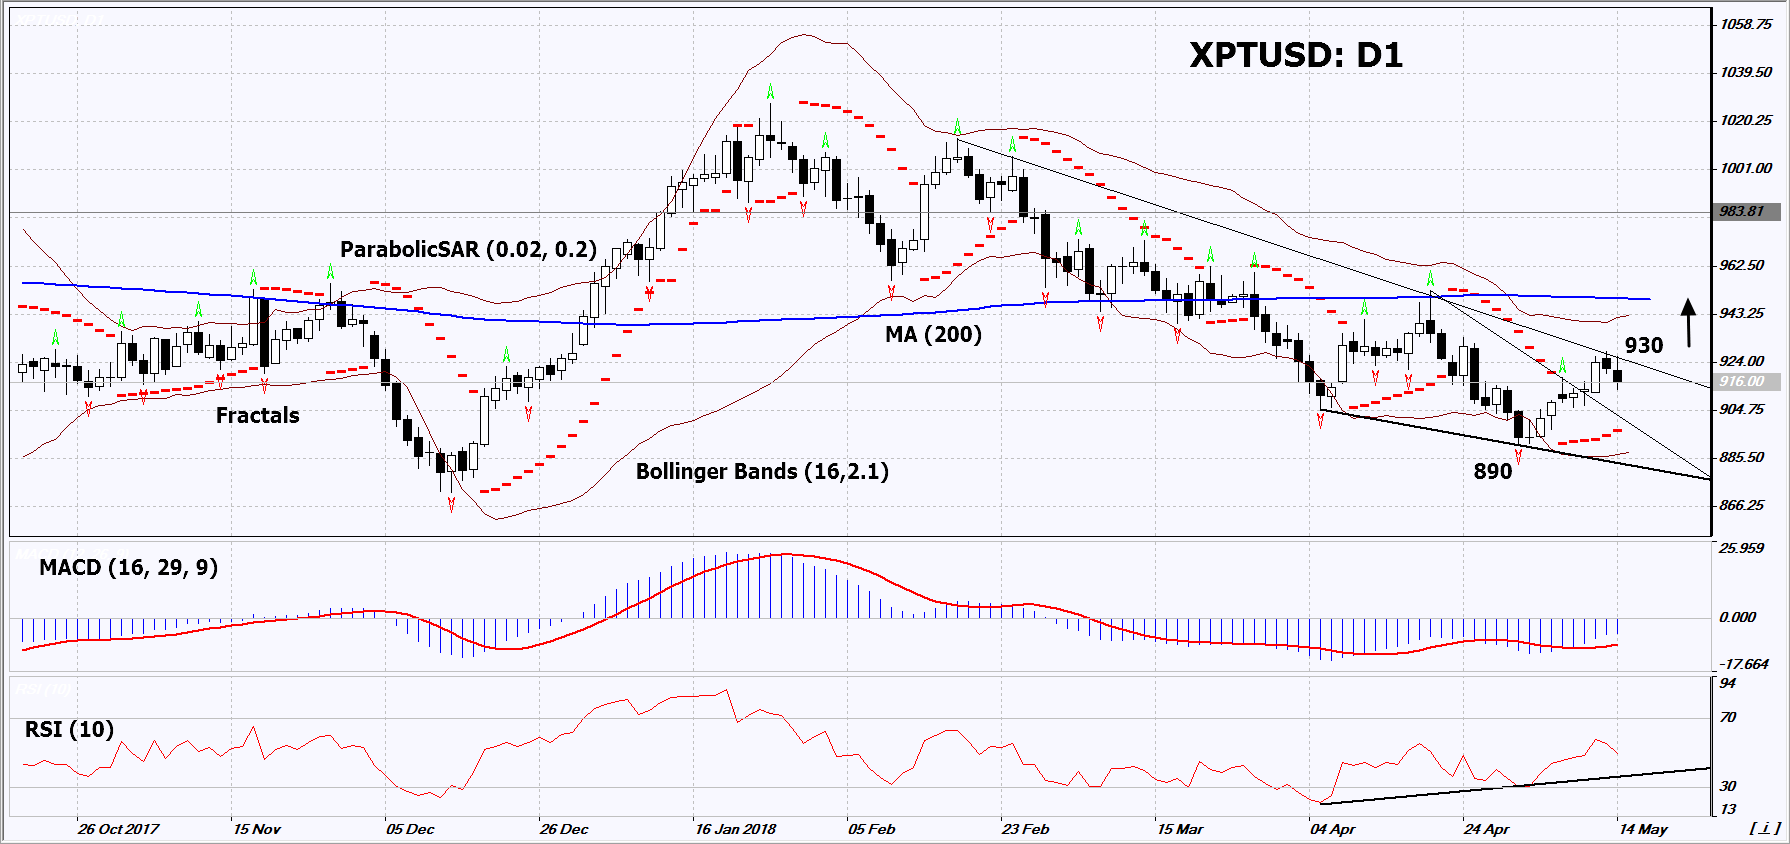
On the daily timeframe, XPT/USD: D1 approached the resistance line of the falling channel. It should be overcome before opening a buy position. The further price increase is possible in case of a reduction in the surplus of platinum and an increase in tensions in the Middle East.
- The Parabolic indicator gives bullish signals.
- The Bollinger bands® have narrowed, which indicates low volatility. They are titled upward.
- The RSI indicator is below 50. It has formed a positive divergence.
- The MACD indicator gives bullish signals.
The bullish momentum may develop in case XPTUSD exceeds the last high and resistance line of the falling channel at 930. This level may serve as an entry point. The initial stop loss may be placed below the last fractal low and the Parabolic signal at 890. After opening the pending order, we shall move the stop to the next fractal low following the Bollinger and Parabolic signals. Thus, we are changing the potential profit/loss to the breakeven point. More risk-averse traders may switch to the 4-hour chart after the trade and place there a stop loss moving it in the direction of the trade. If the price meets the stop level at 890 without reaching the order at 930, we recommend to close the position: the market sustains internal changes that were not taken into account.
Summary of technical analysis
Position Buy
Buy stop Above 930
Stop loss Below 890