Get 40% Off
🚨 Volatile Markets? Find Hidden Gems for Serious OutperformanceFind Stocks Now

S&P 500 Closes Week Below Critical Technical Support. What Next?

Published 09/21/2020, 04:39 AM
Updated 09/20/2023, 06:34 AM

The S&P 500 finished the week below its 50-day moving average and critical technical support. It makes this a crucial week for the market.

S&P 500

Should the S&P 500 firmly drop below 3,300, it likely sets up a further drop to around 3,260, and then to about 3,180. The area around 3,340 should now act as a severe level of resistance for the S&P 500 going forward.
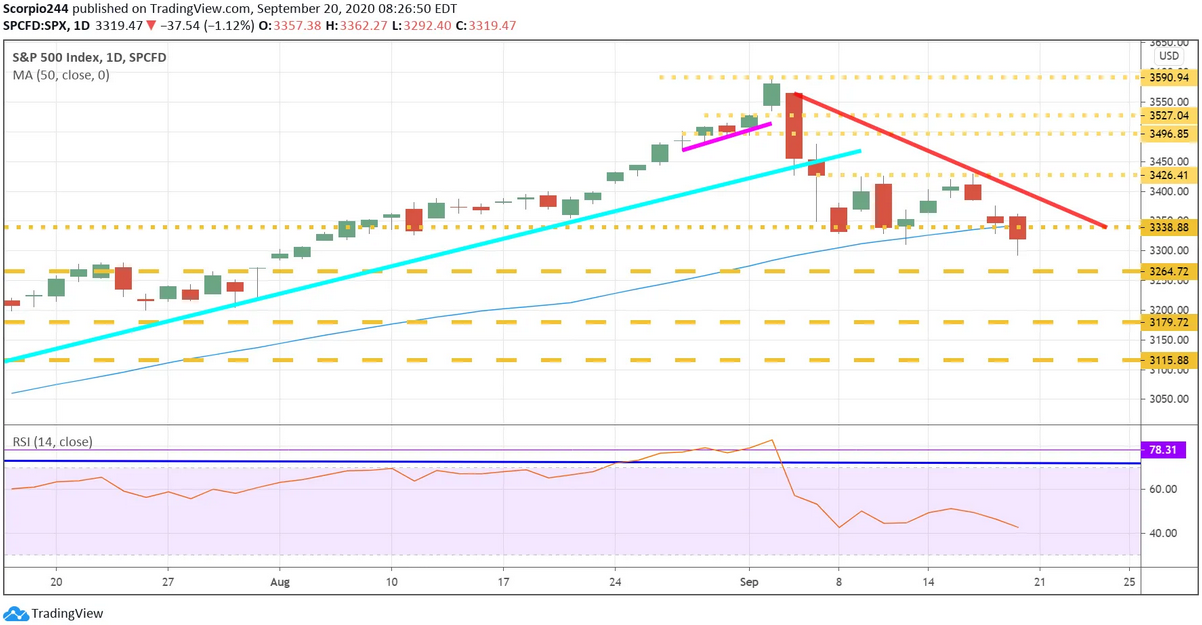
S&P 500 Daily Chart

Amazon

Amazon (NASDAQ:AMZN) is likely not finished falling and heading towards $2,800. Volume levels have been surging, which indicates more sellers are coming out; the stock is not even oversold yet.
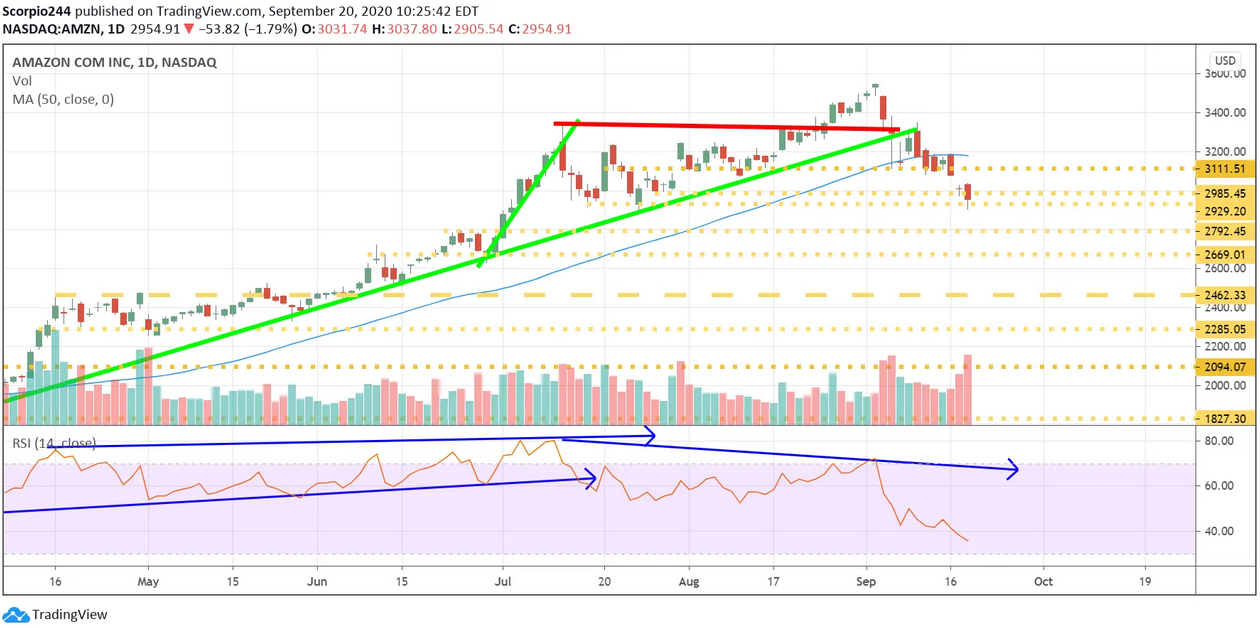
Amazon Inc Daily Chart

NVIDIA

Nvidia (NASDAQ:NVDA) shares have been falling and are likely heading even lower from here. The stock is resting on a significant uptrend, and once that brakes, the shares are likely to fall sharply. Volume levels have surged, the RSI is heading lower, add in some bearish option betting, and this stock is likely heading 15% lower from here.
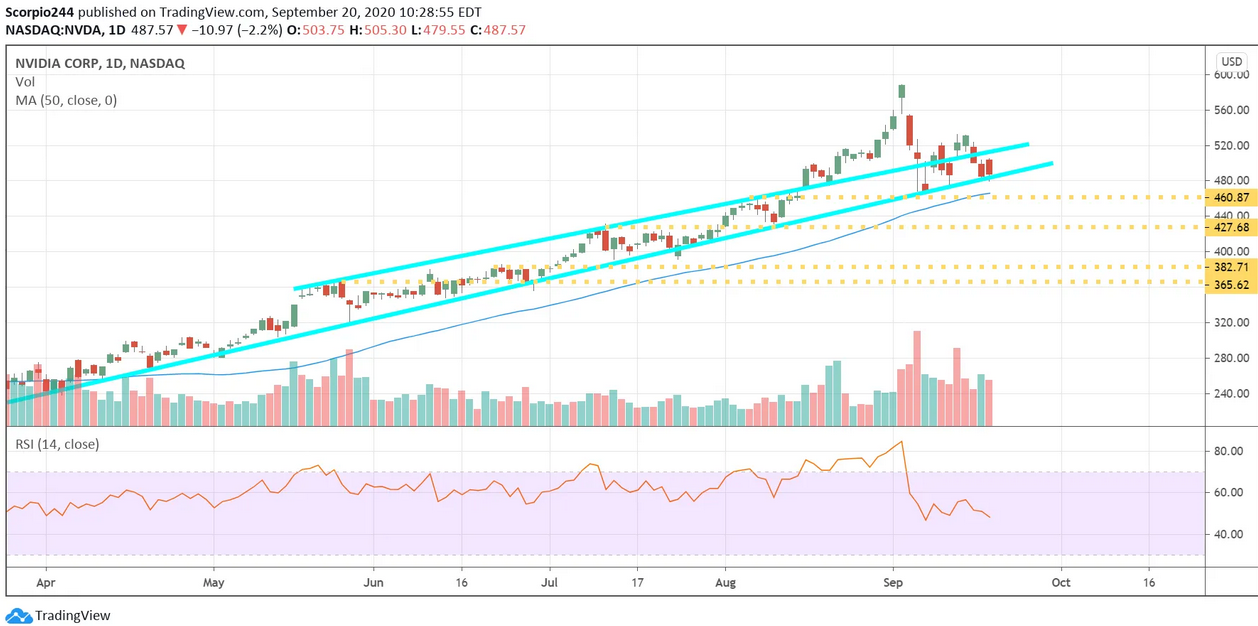
NVIDIA Corp Daily Chart

Salesforce

Salesforce (NYSE:CRM) is likely heading lower from here, as it sits on support at $240, with that monster post-earnings gap that needs to filled down around $219.
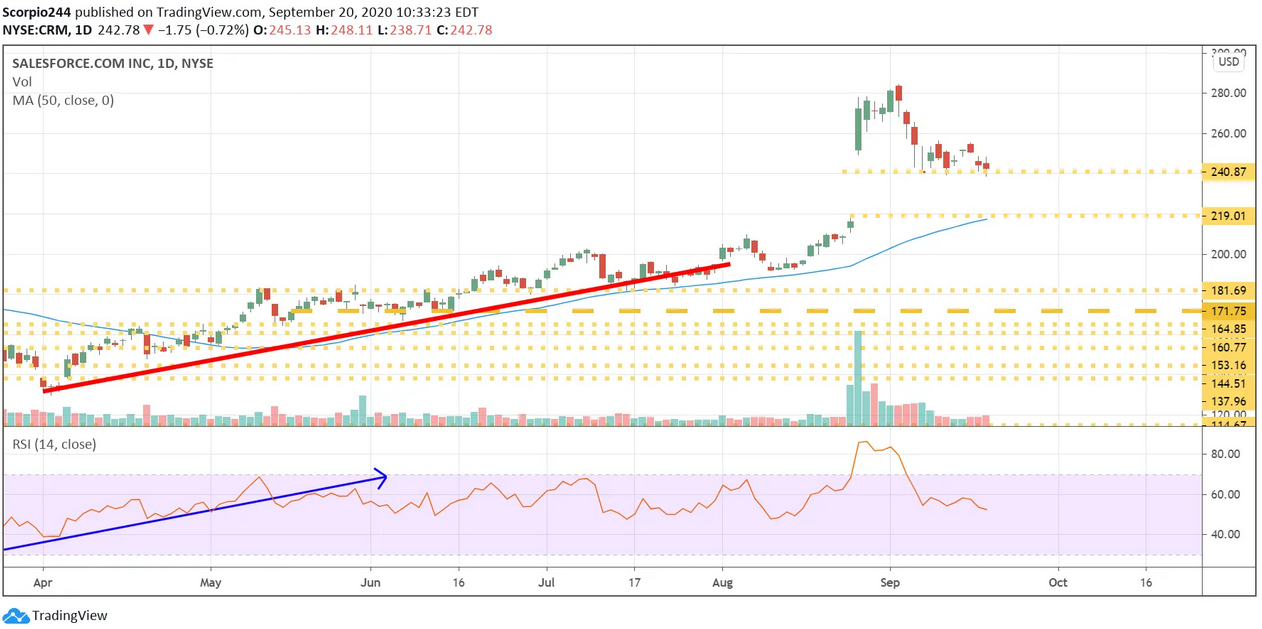
Salesforce Inc Daily Chart

Apple

Apple (NASDAQ:AAPL) also finished the week below crucial support around $108; as I highlighted earlier this week, there is a good chance this one is heading to $96.
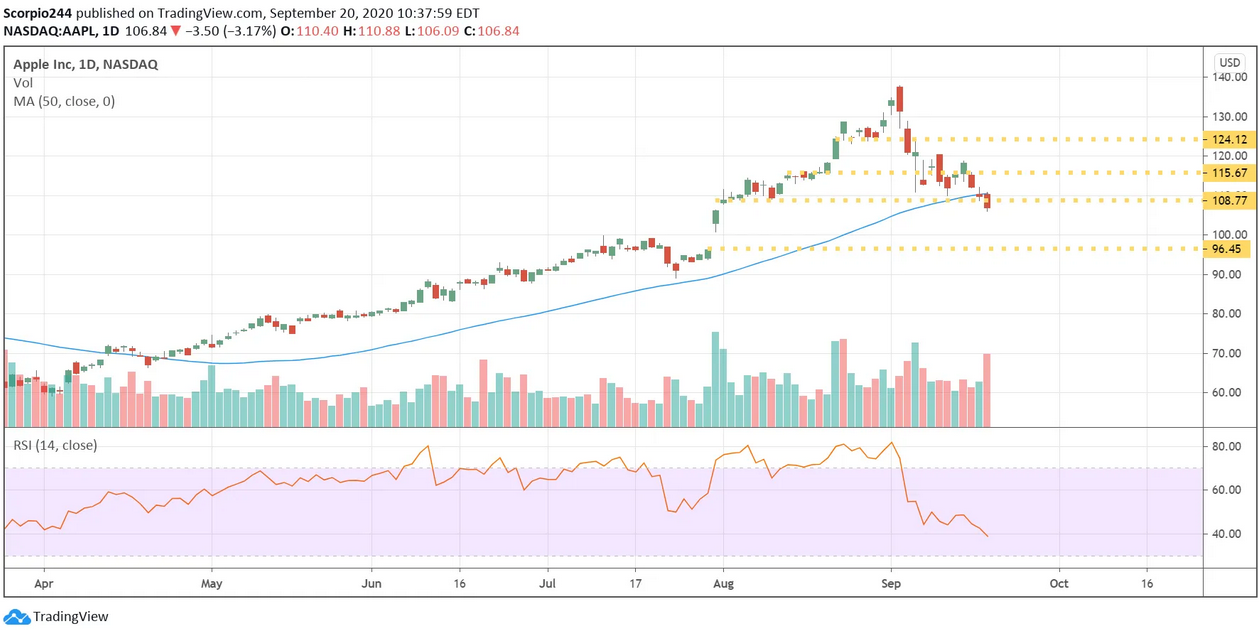
Apple Inc Daily Chart

AMD

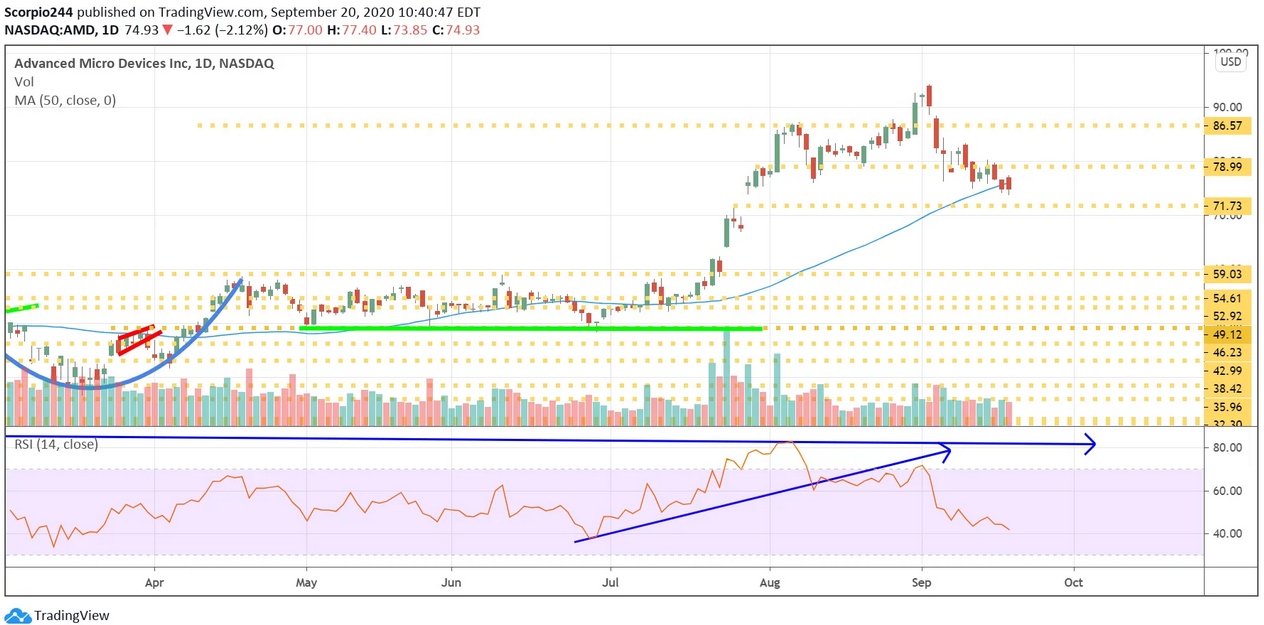
Advanced Micro Devices Inc (NASDAQ:AMD) finished the week off just below its 50-day moving and nearing support at $71.70. A break of support at $71.70 probably pushes the shares lower to around $59.
3rd party Ad. Not an offer or recommendation by Investing.com. See disclosure here or remove ads .

AMD Daily Chart

JPMorgan

JPMorgan Chase & Co (NYSE:JPM) is very close to breaking critical support at $97.50. If that level breaks, watch for $88.50.
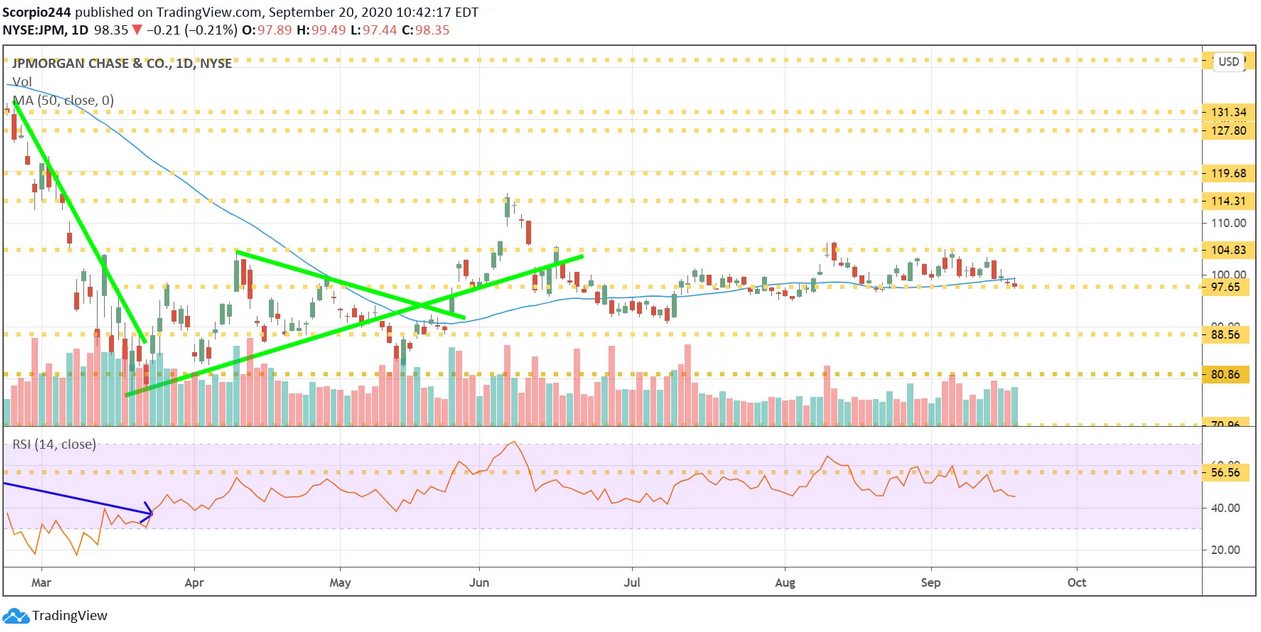
JPMorgan Daily Chart

Citigroup

Citigroup (NYSE:C) has been slammed, and it likely isn’t finished, potentially falling to $41.20.
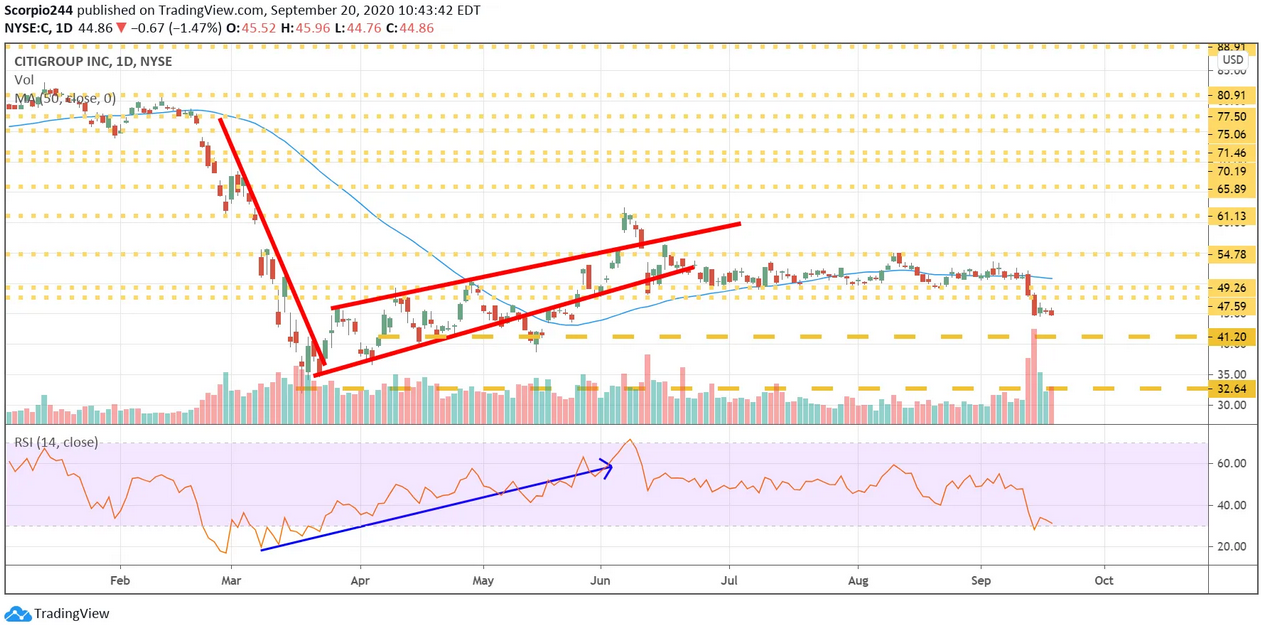
Citigroup Daily Chart

Square

If Square (NYSE:SQ) breaks that uptrend, it is a very long drop to $118. I think it does fall.
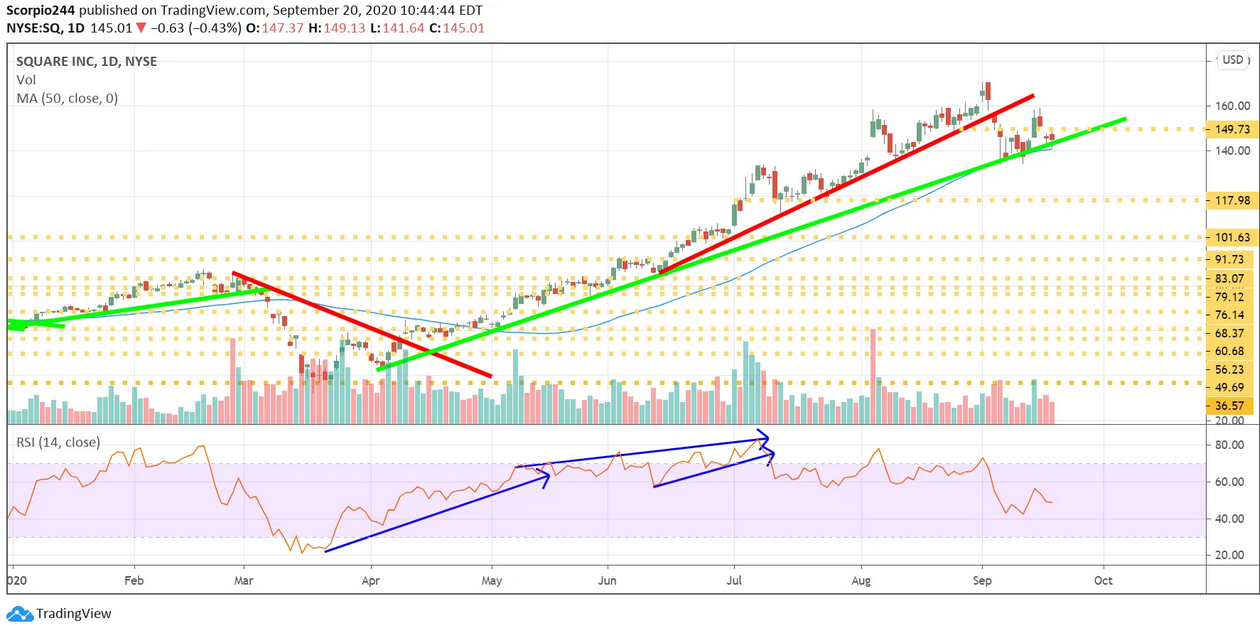
Square Inc Daily Chart

Original Post

Latest comments

Risk Disclosure: Trading in financial instruments and/or cryptocurrencies involves high risks including the risk of losing some, or all, of your investment amount, and may not be suitable for all investors. Prices of cryptocurrencies are extremely volatile and may be affected by external factors such as financial, regulatory or political events. Trading on margin increases the financial risks.
Before deciding to trade in financial instrument or cryptocurrencies you should be fully informed of the risks and costs associated with trading the financial markets, carefully consider your investment objectives, level of experience, and risk appetite, and seek professional advice where needed.
Fusion Media would like to remind you that the data contained in this website is not necessarily real-time nor accurate. The data and prices on the website are not necessarily provided by any market or exchange, but may be provided by market makers, and so prices may not be accurate and may differ from the actual price at any given market, meaning prices are indicative and not appropriate for trading purposes. Fusion Media and any provider of the data contained in this website will not accept liability for any loss or damage as a result of your trading, or your reliance on the information contained within this website.
It is prohibited to use, store, reproduce, display, modify, transmit or distribute the data contained in this website without the explicit prior written permission of Fusion Media and/or the data provider. All intellectual property rights are reserved by the providers and/or the exchange providing the data contained in this website.
Fusion Media may be compensated by the advertisers that appear on the website, based on your interaction with the advertisements or advertisers.
© 2007-2024 - Fusion Media Limited. All Rights Reserved.