It will be a big week for economic data with the ISM Services Index, ADP job report, and the BLS job report. These are pretty much as important as they come when it comes to helping us determine the strength of the US economy. I continue to believe the economy here in the US is improving. Fourth GDPNow forecast suggests growth of 2.3% and based on my previous analysis, that suggests to me the economy may be growing by as fast as 2.8%. The ISM Manufacturing report on Friday was a disappointment, so I’m going to need to see good numbers this week to give me confidence that the economy is going in the direction I think it is going.
Tel Aviv
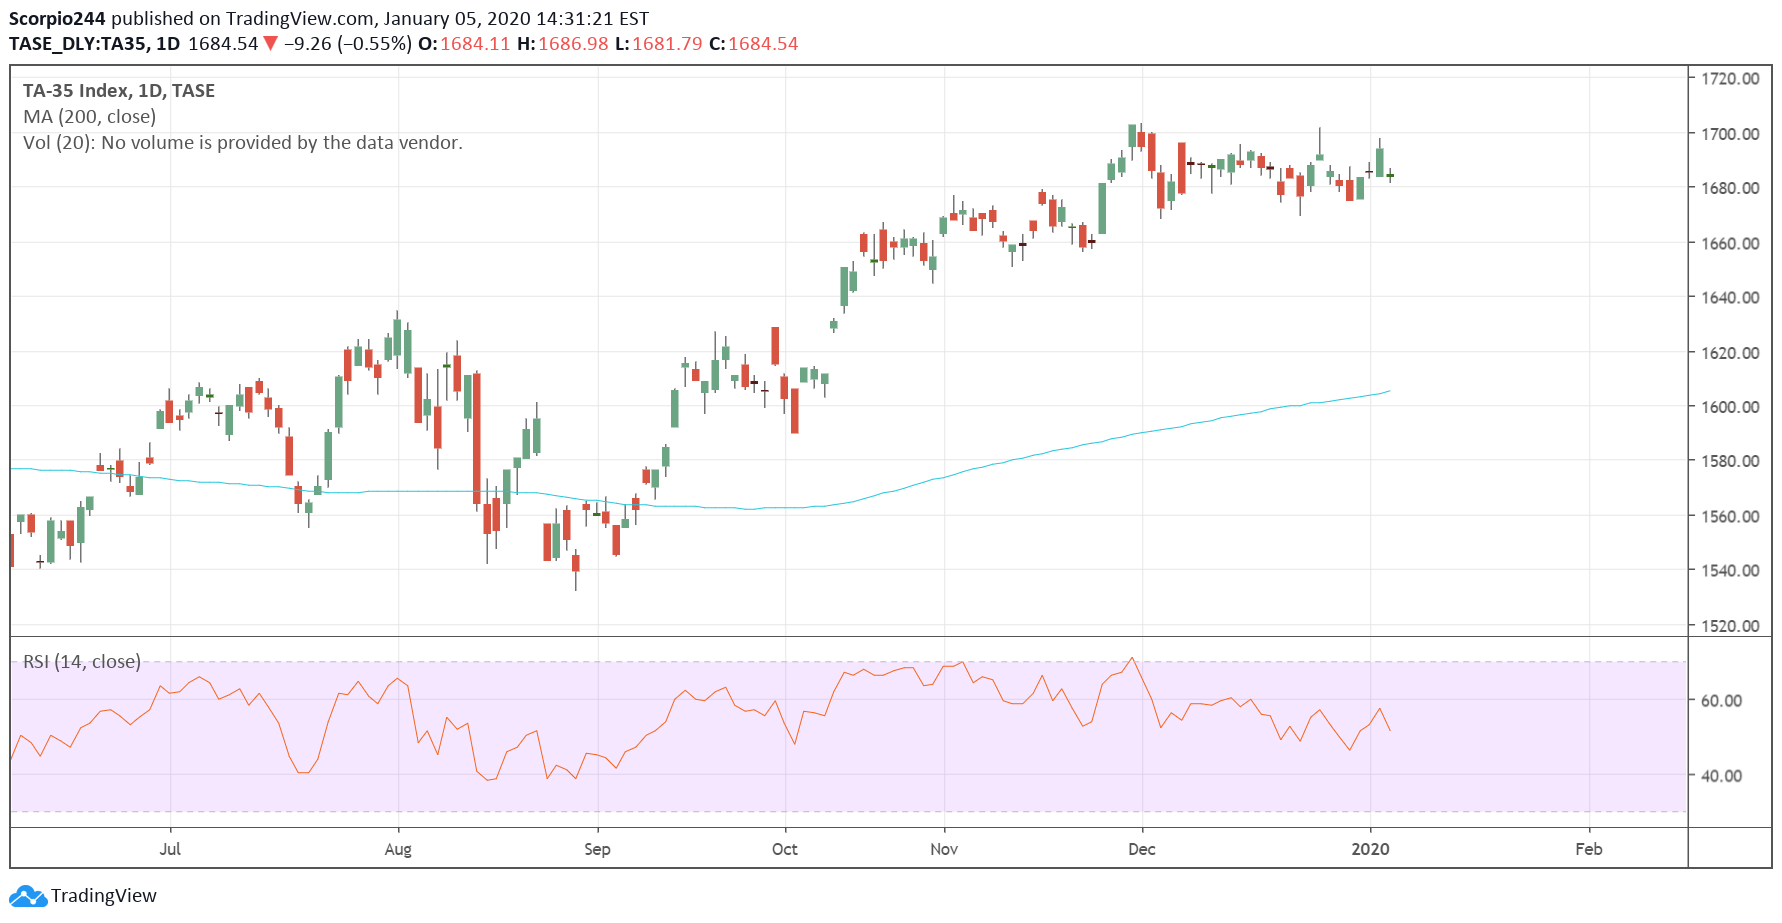
There is little way of knowing how the market will respond to the rising tensions with Iran, but based on how Israel traded overnight, there wasn’t much of a reaction, with the Tel Aviv 35 Index trading lower by 55 bps.
Apple (AAPL)
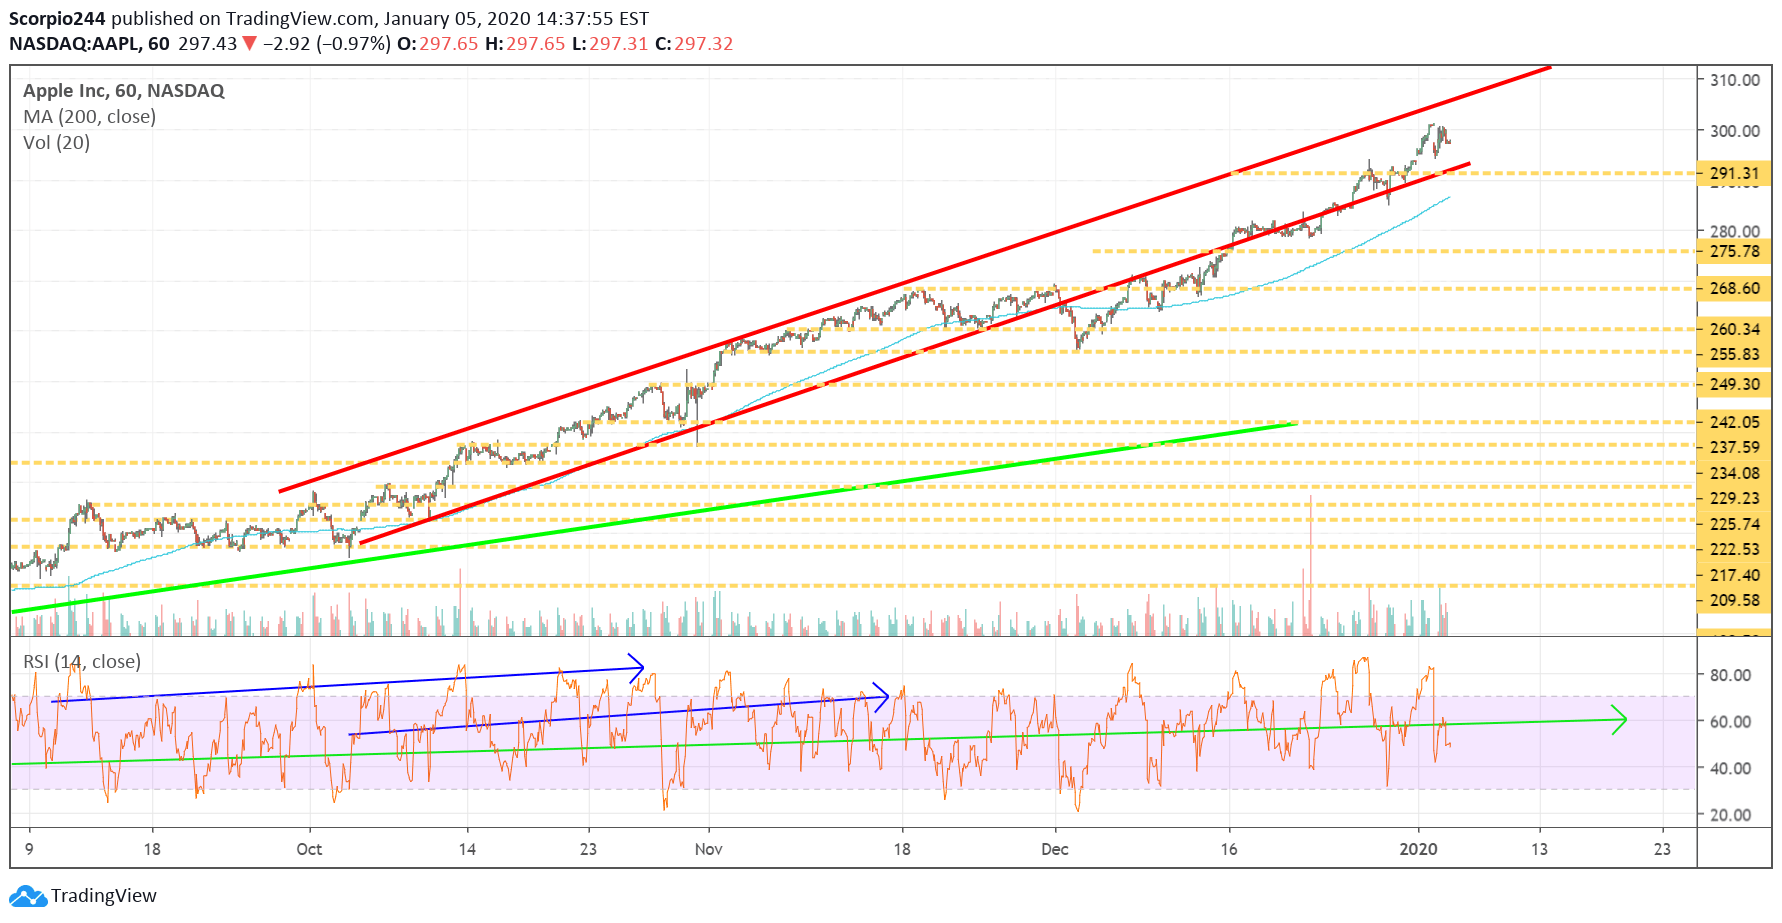
Anyway, Apple (NASDAQ:AAPL) continues to move high as investors are seemingly re-rating the stock, and while it isn’t clear to me how much further Apple can run, it would seem that over the short-term, it must be getting closer to the end of the rally, then the beginning. Currently, analysts estimates forecast the company to earn $16 in 2022, and at 20 times estimates, the stock is worth $320. The chart suggests the next level of resistance comes around $310.
Tesla (TSLA)
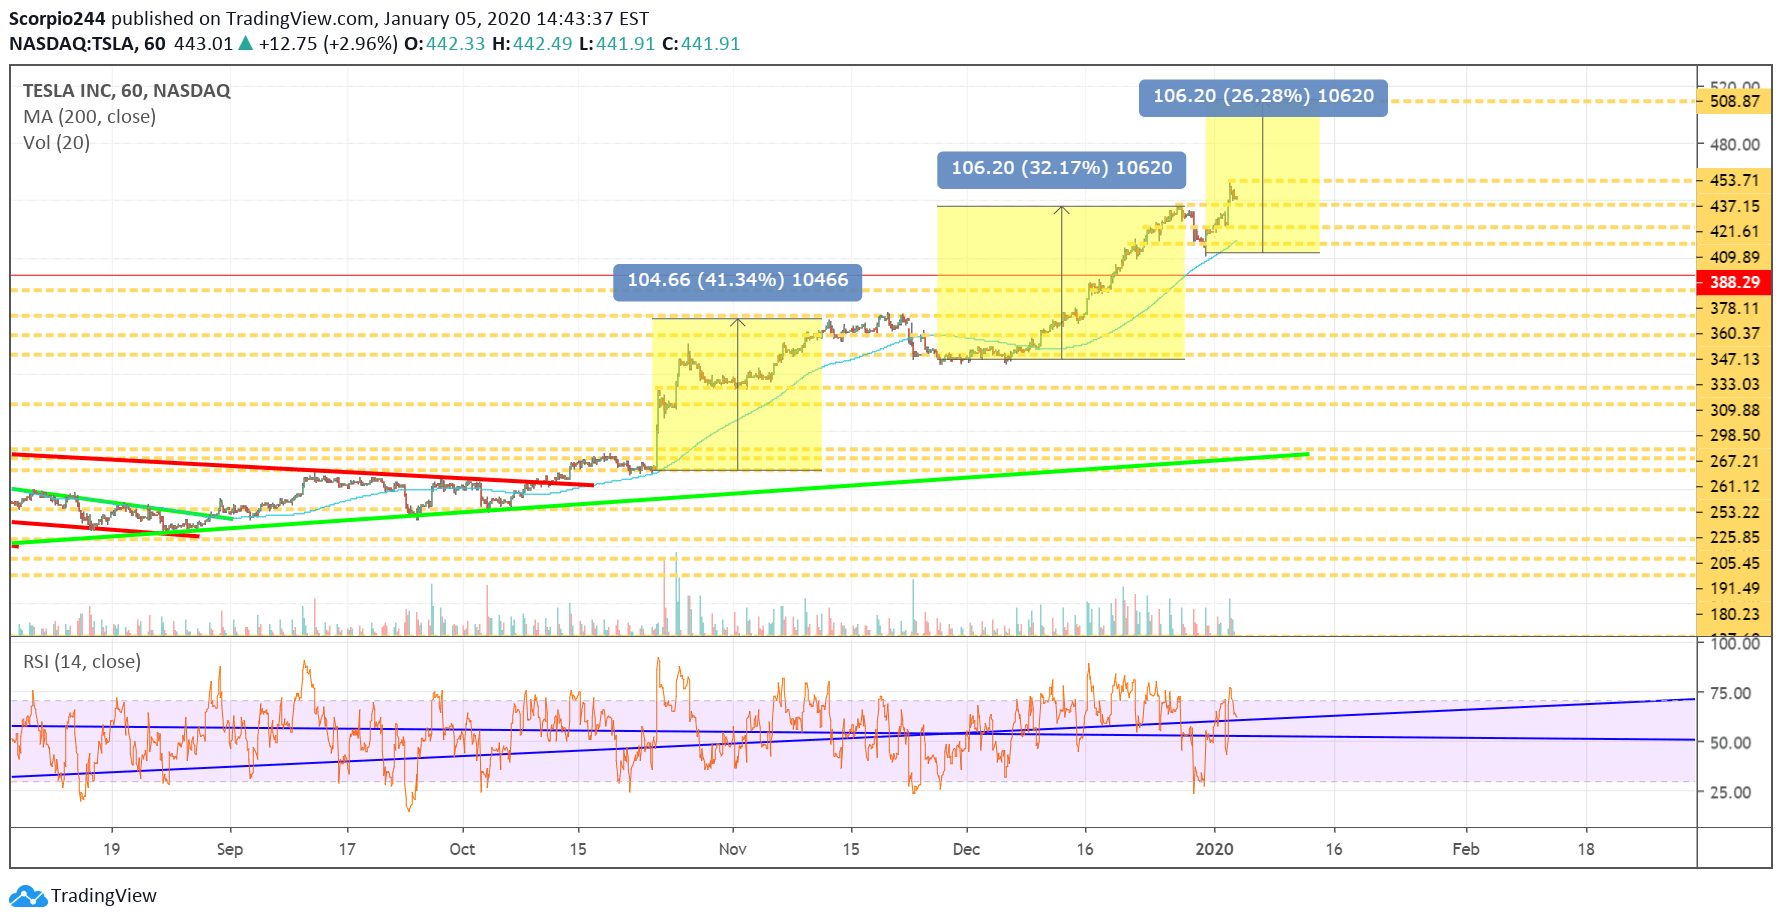
Tesla (NASDAQ:TSLA) could be heading to $500. Call me crazy, sure. But look at the pattern in the chart, hard to deny there isn’t something to it.
Netflix (NFLX)
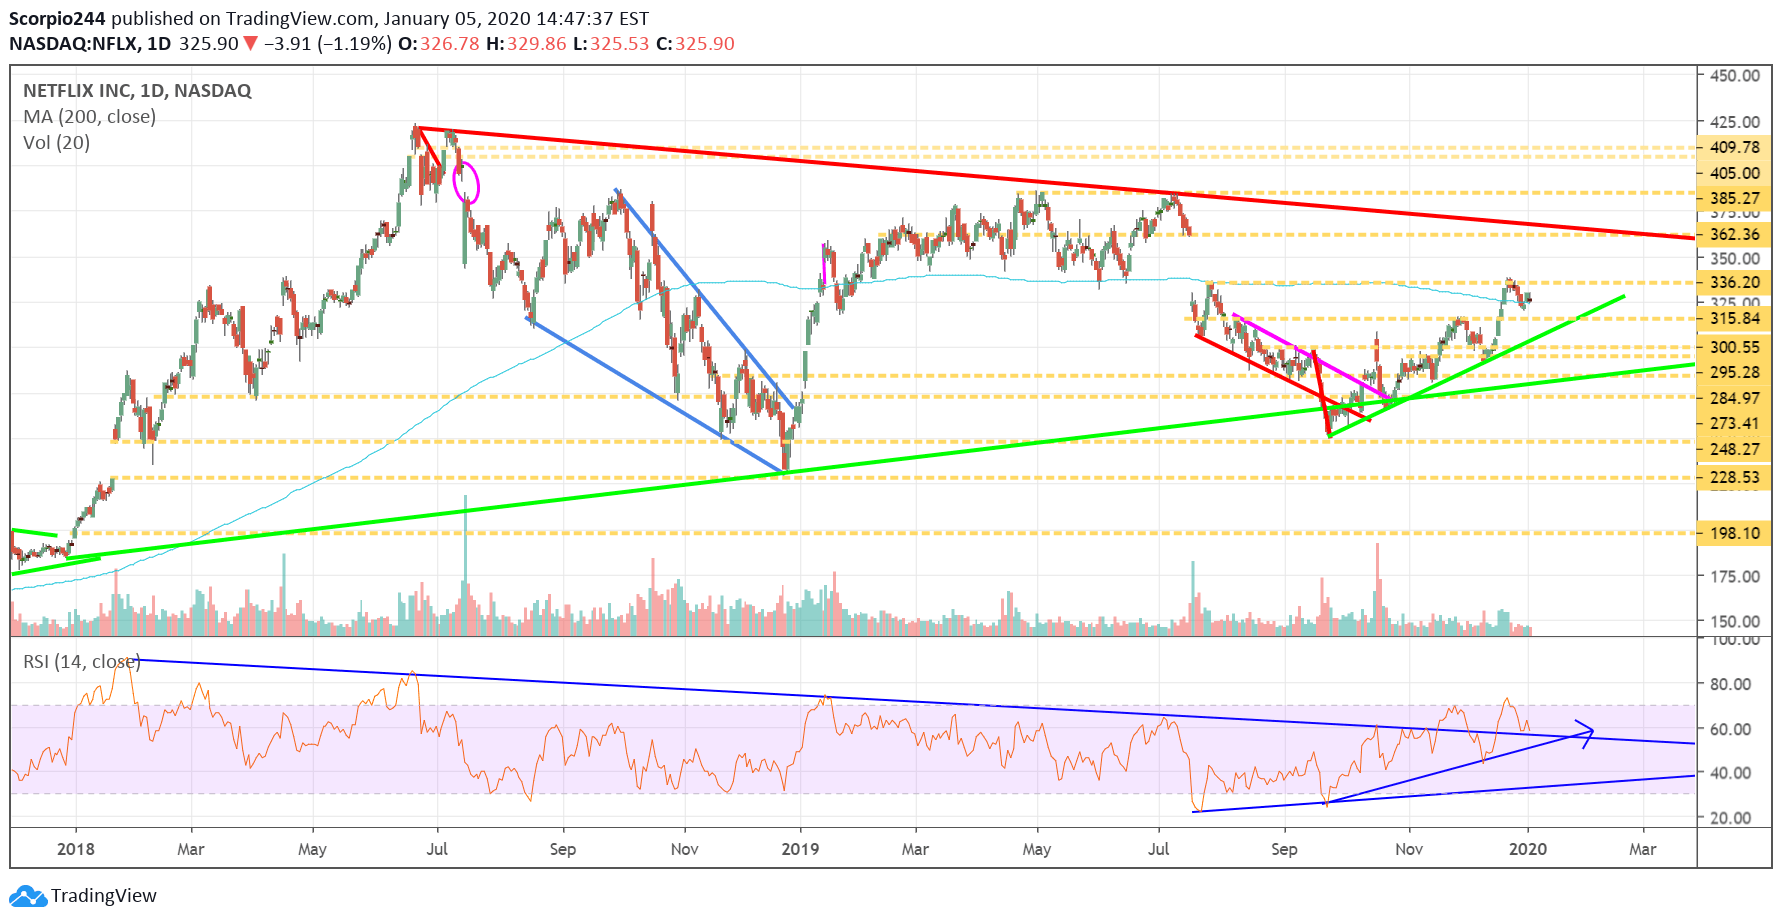
I think that Netflix (NASDAQ:NFLX) continues to trend higher, at least the RSI suggests that it does. The RSI broke free of a multi-year downtrend, and it indicates to me that Netflix is likely to see its RSI continue to trend higher in the future. That means the stock continues to rise, with the next level of resistance at $336. A gap-fill would follow that up to $360.
Exxon (XOM)
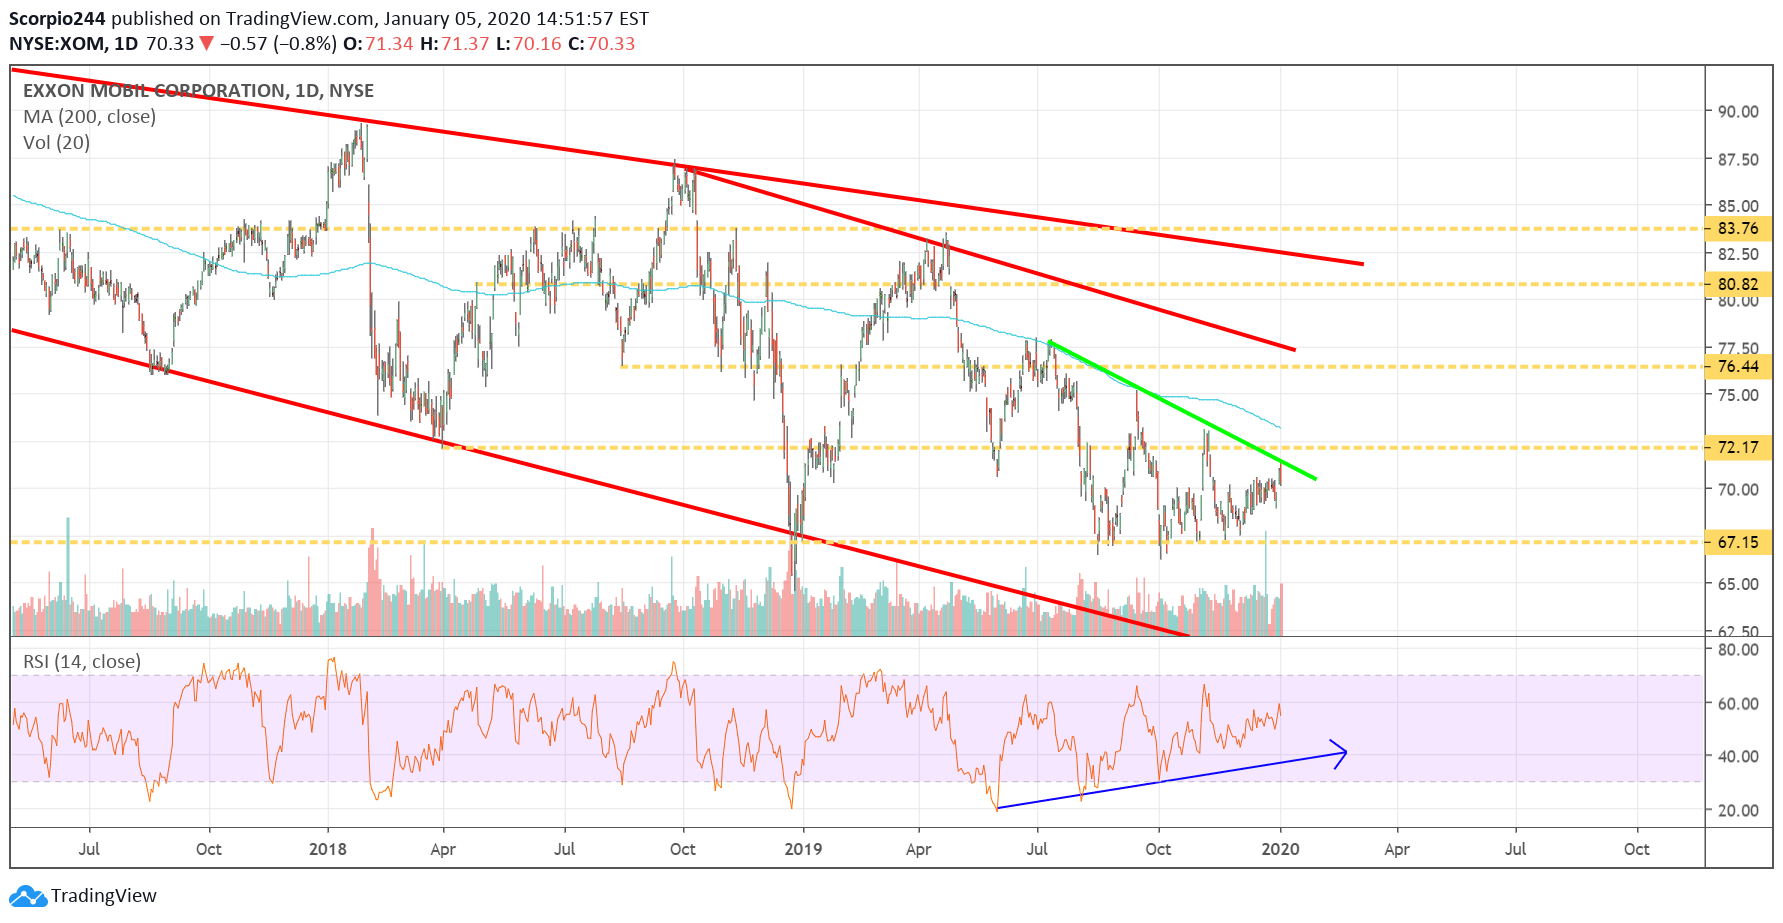
There is currently a bullish divergence forming in Exxon (NYSE:XOM), with that RSI rising higher, and stock price going nowhere. Exxon is very close to breaking free of a downtrend and rising above resistance at $72. If that happens, $76 is the next level to watch for.
Snap (SNAP)
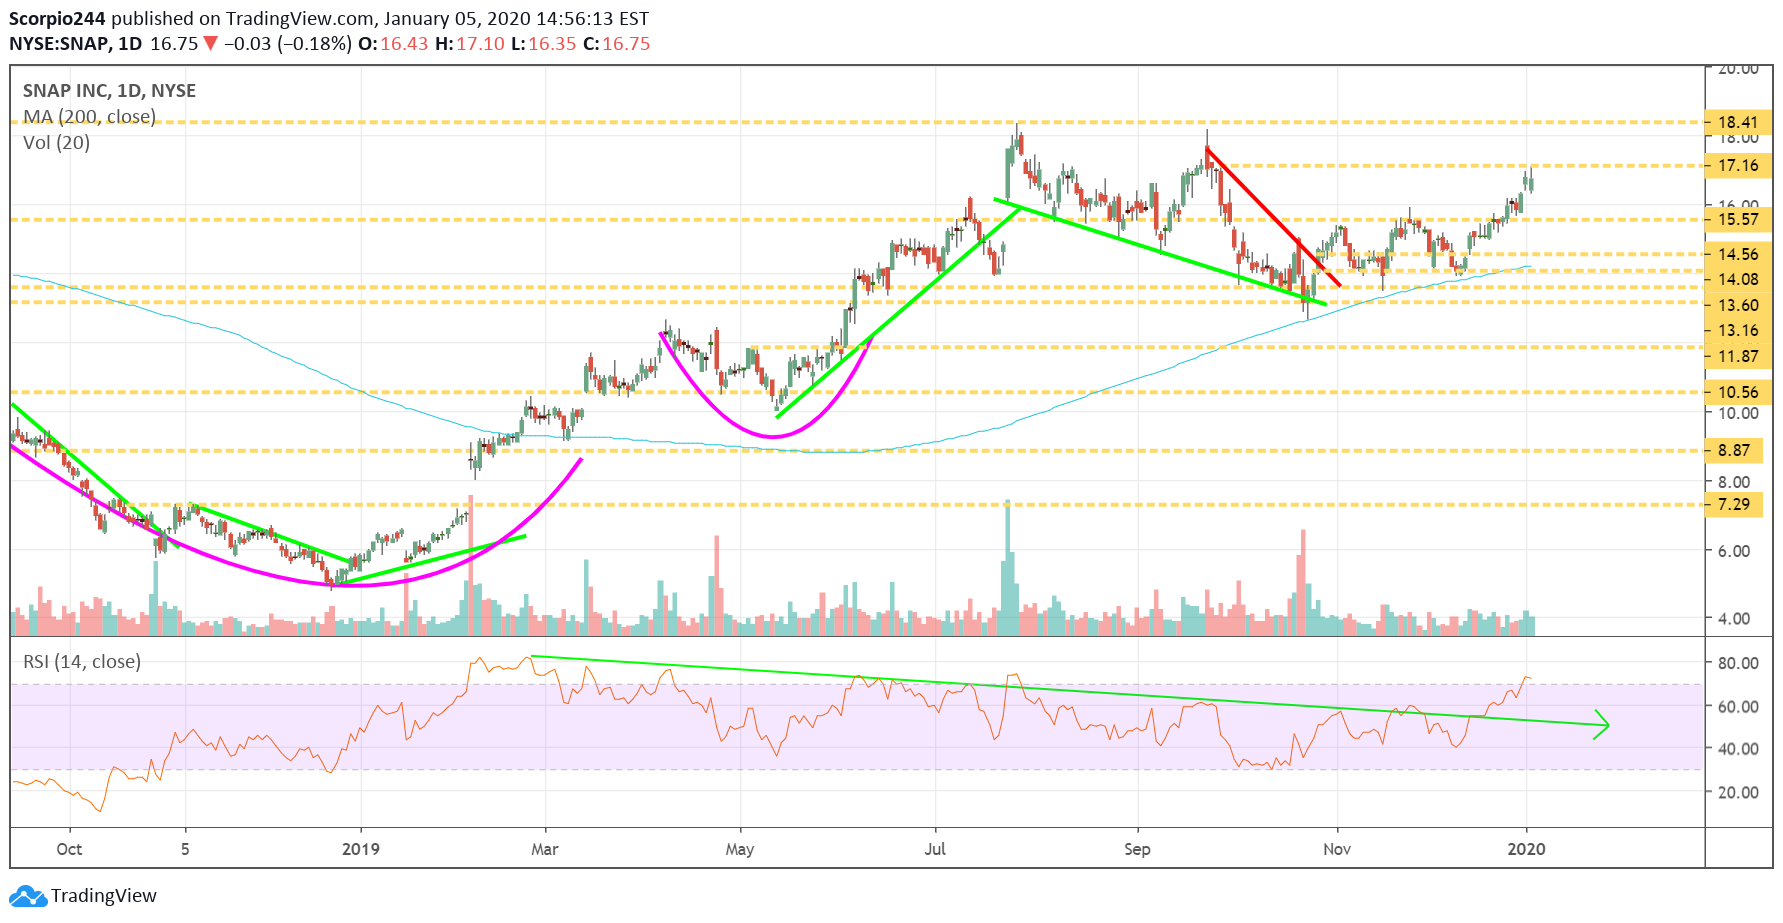
Snap (NYSE:SNAP) is another stock nearing a breakout, with resistance at $17.20. The stock could have upside to $18.40.
Facebook (FB)
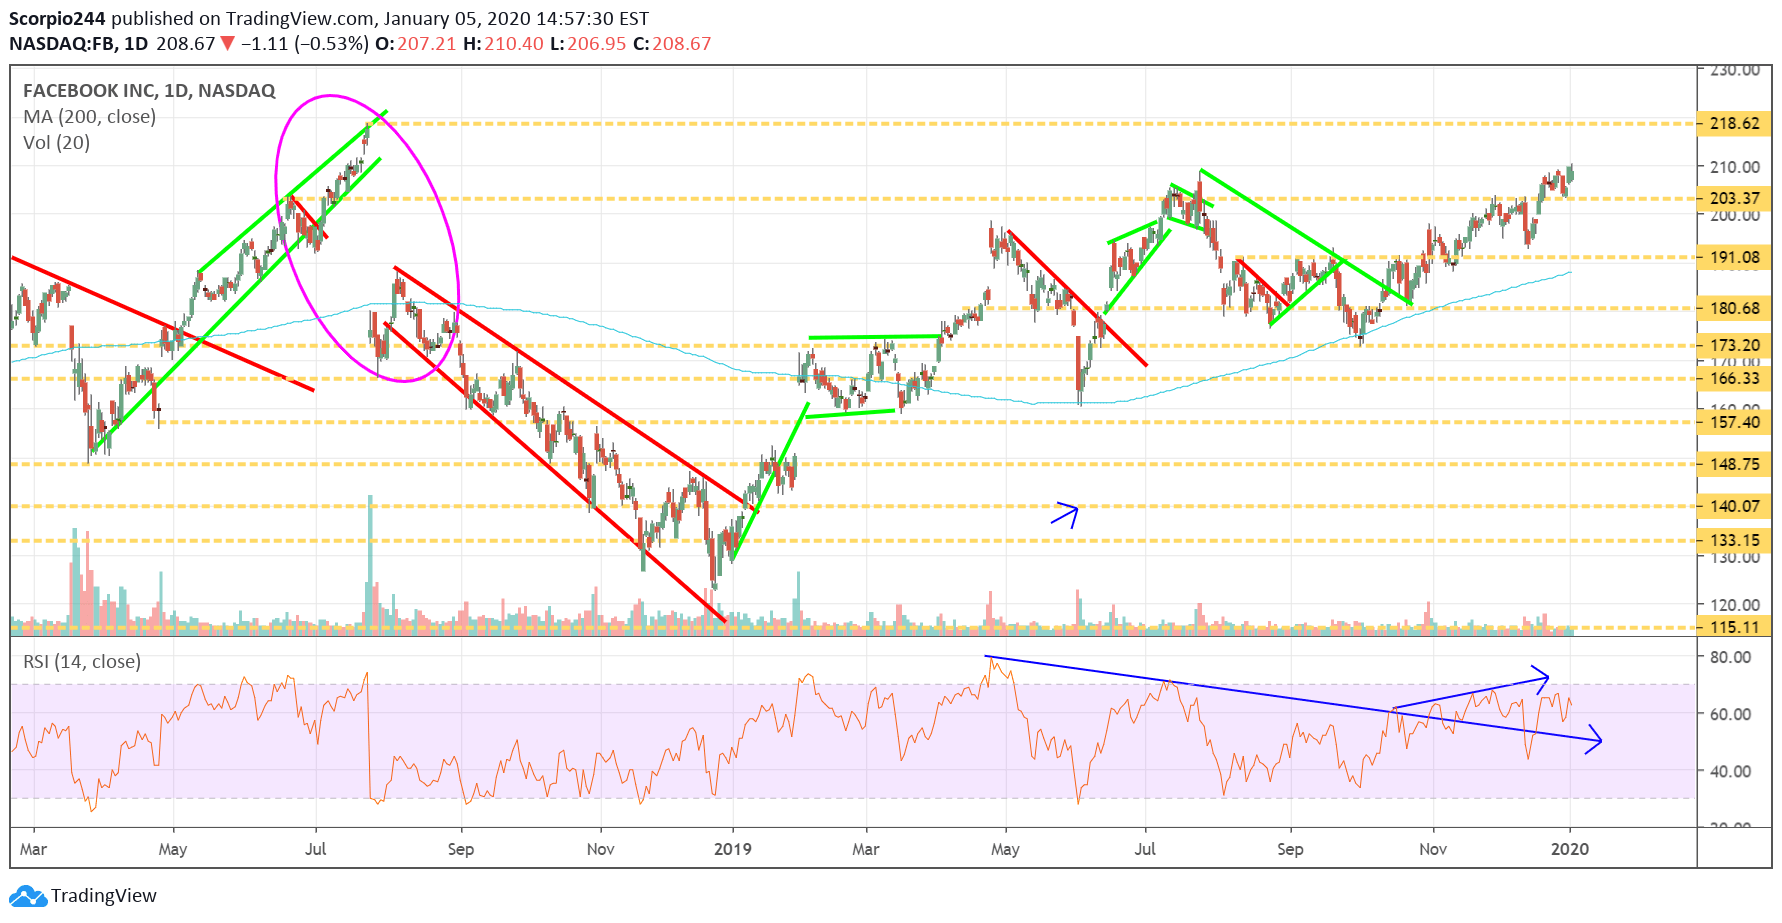
Facebook (NASDAQ:FB) clearly wants to fill the gap up to $218.
Roku (ROKU)
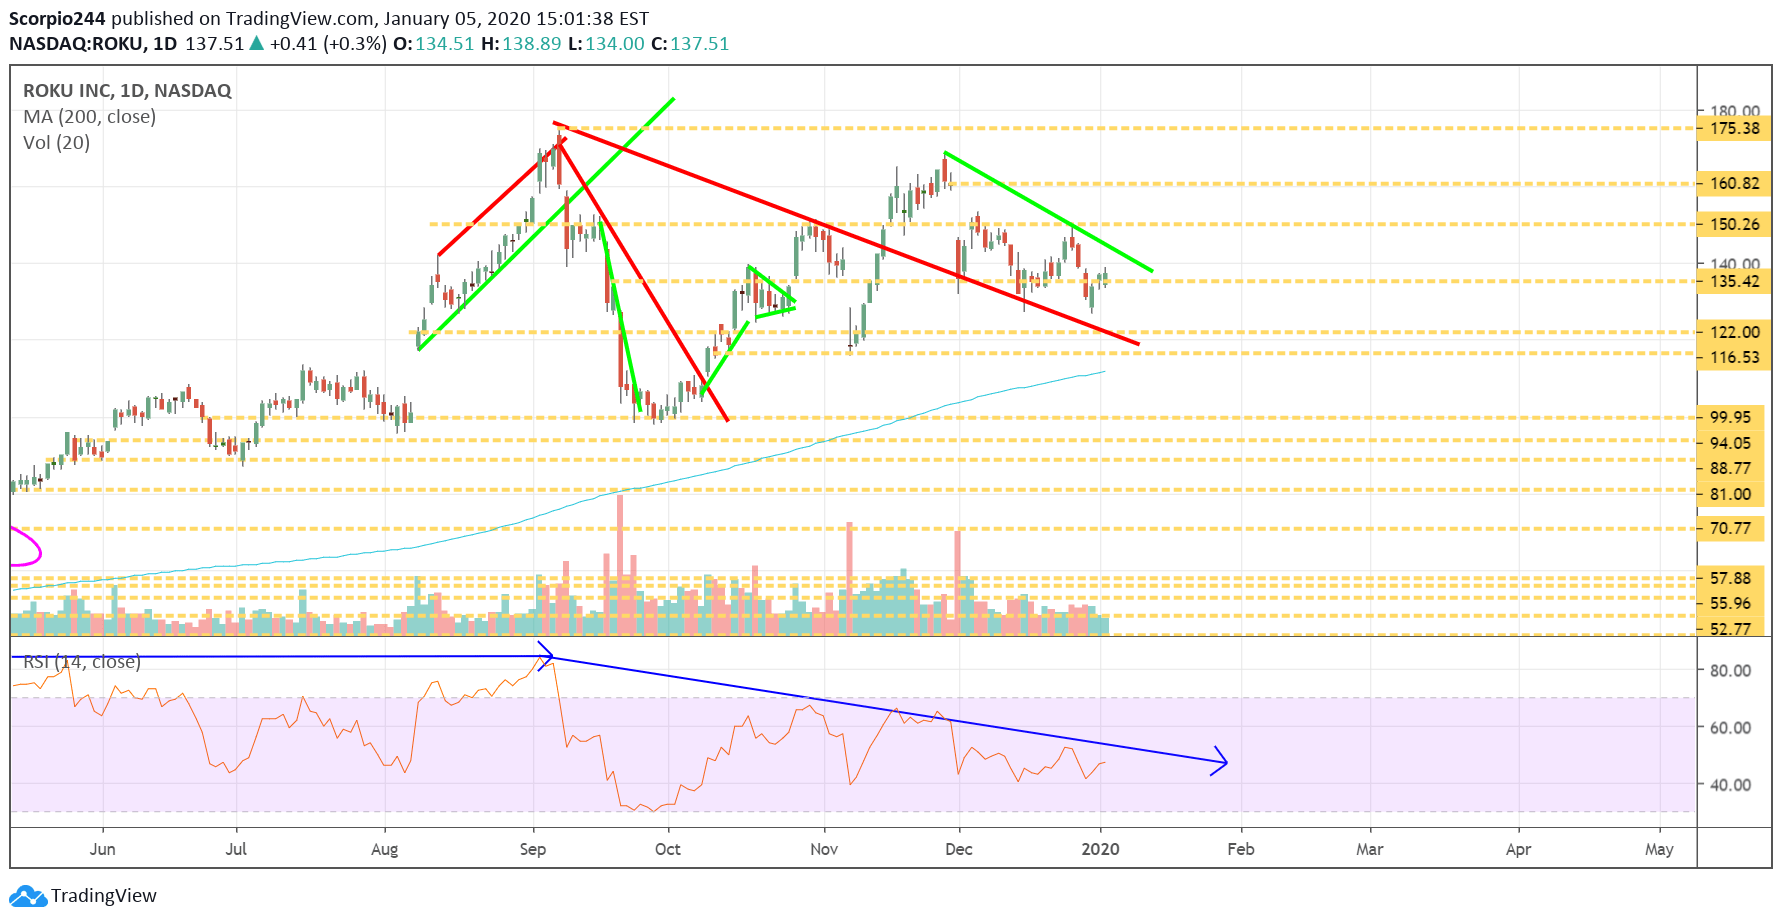
I should have been more clear on Roku (NASDAQ:ROKU) yesterday. I think the stock rises to around $141 this week and then heads lower again over the short-term.
