Apple (NASDAQ:AAPL) started 2017 moving up out of consolidation at 115 and over the previous high. It continued higher all year reaching 177, nearly a 54% gain, in December. Along the way it paused and consolidated from April through to August and then again from August to the end of October. After a quick run higher, it started to consolidate again in November and remains in consolidation.
A closer look shows a rounding support starting to lift as it makes higher lows. This is showing up in the RSI as well. And the MACD has reset near zero and is now crossed up and rising again. Even the Bollinger bands® are starting to turn higher. Friday ended at an all-time-high close against resistance. A break above would give a target to 192. That would put the stock less than 2.5% away from a market cap of $1 Trillion. There is no resistance higher and support lower comes at 174.50, 169.50 then 167. Short interest is low at 1% and the company is expected to report earnings next on February 1.
Open Interest
The monthly options chain for January shows the biggest open interest by far at the 170 Strike on both sides. Open interest tails to the upside on the calls and the downside on the puts, making a max pain level at 170 for options holders. The February 2 Expiry options find the open interest on the put side centered on 165 and on the call side, its rising from 170 to a peak at 187.50, but the total size is small. February monthly options show Put side open interest rising from 130 to 170. But that peak is only half of the peak on the call side at 175. There, it tails to 155 below and 200 above.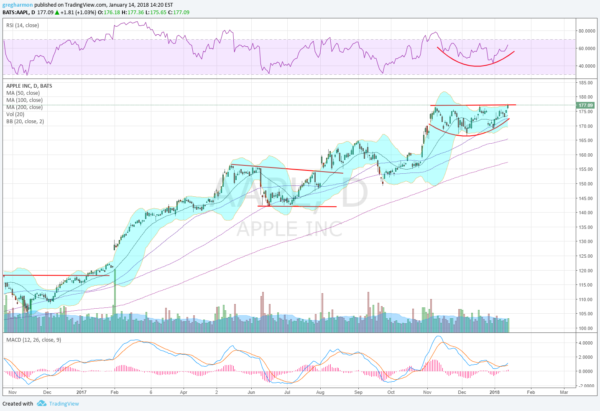
4 Ways To Trade Apple
- Trade Idea 1: Buy the stock on a move over 177.25 with a stop at 172.
- Trade Idea 2: Buy the stock on a move over 177.25 and add a February 2 Expiry 175/165 Put Spread ($2.50) also selling the April 200 Calls ($1.40) to lower the cost of protection.
- Trade Idea 3: Buy the February 165/185 bull Risk Reversal (65 cents).
- Trade Idea 4: Buy the January 26 Expiry/February 180 Call Calendar ($2.60).
Elsewhere look for gold to continue in its uptrend while crude oil blazes its own path higher. The US Dollar Index is in trouble and may be on the verge of a break down while US Treasuries consolidate in a broad range. The Shanghai Composite and Emerging Markets have broken their consolidation to the upside and look to continue higher.
Volatility looks to remain at very low levels keeping the bias higher for the equity index ETF’s SPY, IWM and QQQ. The IWM has finally joined the party moving to new highs while the SPY and QQQ have continued to trade in tandem. Their charts all look strong on both the short- and long-time frame. Use this information as you prepare for the coming week and trad’em well.