The slow rollover in stocks continues…
The market continues to look for catalysts to stop the fall in stock prices. As investors finish their last week of summer vacation and head back to work, they will return to weigh 10%+ lower valuations of equities versus the increased risks to earnings from slower global growth. And while some industries will benefit from much lower energy prices, others will be hurt by the losses caused from a shrinking energy industry. Airlines get help from falling jet fuel prices and rising consumer wealth. Homebuilders are helped by low interest rates and rising apartment prices. But while the relative outperformance of these sectors and others is good for the portfolio managers that own them, for absolute investors, there is nothing like having a portfolio laden with cash in times like these. As one of my former Janus portfolio managers used to say, “You can’t eat relative returns.” So either the market needs a catalyst to get investors to step up and BUY or it just needs time to readjust to these lower prices. Stay tuned as September is a big conference month. And with the increased slowdown in China and oil, there are bound to be many negative preannouncements. The question is, will those impacts already be expected in these 10%+ lower stock prices.
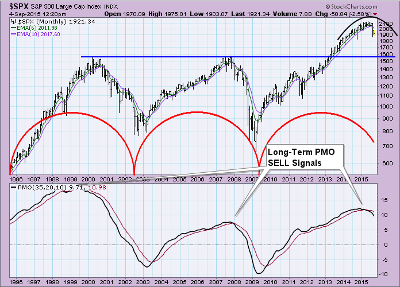
A rollover in all the technical moving averages and momentum indicators continues to ripple through the major indexes…
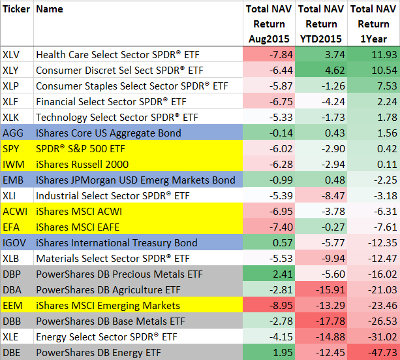
The major Asset Class ETFs show the void of positive returns for August, for 2015, and for the 1 year period. The lack of positive returns will only cause more investors to look toward the safety of cash…
Mutual Funds are feeling the pinch as investors withdraw the most assets in 2 years…
Turmoil in financial markets prompted investors to pull $27.3 billion from U.S. mutual funds last week, the biggest withdrawal in more than two years. Stock funds suffered redemptions of $11 billion in the week ended Aug. 26, while bond funds saw outflows of $12.1 billion, according to a statement Wednesday from the Investment Company Institute, a Washington-based trade group. Funds that buy a mix of stocks and bonds had redemptions of $4.3 billion… The last time investors withdrew more money from mutual funds was the week that ended June 26, 2013, when they pulled $28.7 billion, ICI data showed.
(Bloomberg)
Even Calstrs is looking to take 12% of its Equity risk off the table and go hunt elsewhere…
The nation’s second-largest pension fund is considering a significant shift away from some stocks and bonds amid turbulent markets worldwide, one of the most aggressive moves yet by a major retirement system to protect itself against another downturn. Top investment officers of the California State Teachers’ Retirement System have discussed moving as much as $20 billion, or 12% of the fund’s portfolio, into U.S. Treasurys, hedge funds and other complex investments that they hope will perform well if markets tumble, according to public documents and people close to the fund. The board of the $191 billion system, which is known by its abbreviation Calstrs, is expected to discuss the proposal at a meeting later today in West Sacramento, Calif. A final decision won’t be made until November.
(WSJ)
Meanwhile, the Chicago Merc is enjoying all of this volatility and talk of buying of risk protection…
CME (NASDAQ:CME), which operates the world’s biggest futures exchange, has just disclosed trading volumes for August, which were up 25 percent to more than 341m contracts from August, 2014. Here’s a snapshot of the volumes across markets (directly from the CME’s release):
- Interest rate volume averaged 7.9 million contracts per day in August 2015, up 8 percent compared with August 2014.
- Eurodollar futures volume averaged 2.4 million contracts per day, up 7 percent compared with August 2014.
- Foreign exchange volume averaged 890,000 contracts per day, up 33 percent from August 2014.
- Metals volume averaged 381,000 contracts per day, up 36 percent compared with the prior August.
(FastFT)
Falling stock prices makes it easier for Portfolio Managers to beat their benchmarks. But if this correction continues, the real outperformers will be those managers and advisors who got their clients into BIG slugs of cash…
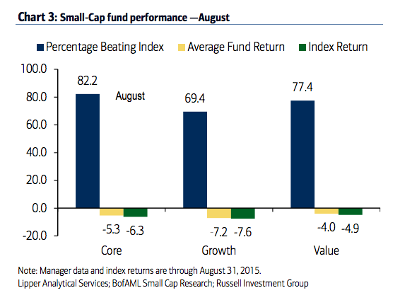
(MerrillLynch/TheReformedBroker)
Value Funds outperforming Growth Funds in this downturn. Interesting to see so many High Beta names at the top of Value Fund portfolios…
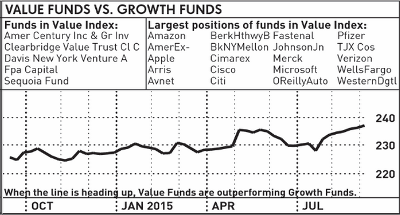
(InvestorsBusinessDaily)
OliviaSterns: The FED can’t use this #jobs report as an excuse NOT to raise rates: wages growing, unemployment 5.1%
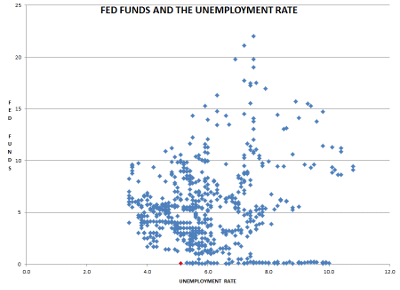
It was a decent Jobs Friday. Headline Non Farm Payrolls disappointed, but the previous revisions made up for the short fall. And the Average Hourly Wage lifted to +0.3%, which is another uptick. With the Unemployment Rate falling to 5.1%, the below chart will cause the academics at the Fed to breath a bit more rapidly…
Macr0man: Since 1954, the lowest FF has been with the u-rate here has been 1.25%…until today
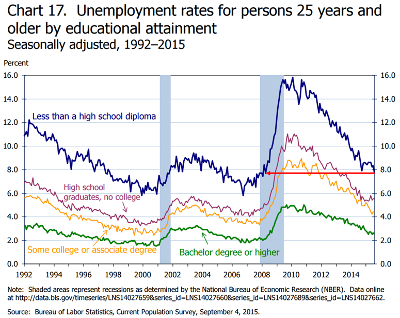
Wage pressures should remain as the less educated continue to show the best employment gains…
So back to looking at U.S. Equity Valuations, we are now below average on some measures…
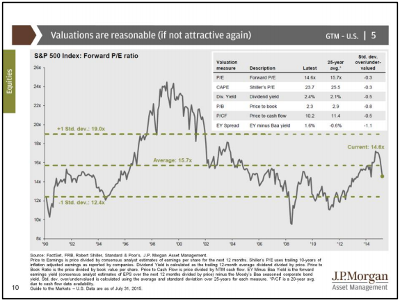
(JPMorgan (NYSE:JPM))
Now where is the Global growth cycle and how will U.S. earnings navigate a peak in earnings growth?
carlquintanilla: MStanley slashes 2016 US GDP forecast by nearly a point, to 1.9% Blames weaker global trade, lower growth potential.
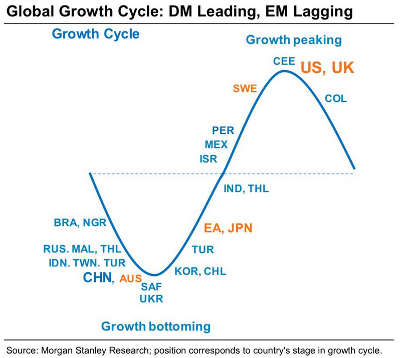
Not helping earnings growth are some recent data points reflecting Asian supply and demand…
Airports from Seattle to Amsterdam are reporting a fall-off in cargo traffic to and from Asia, in what transportation executives and analysts say is a worrying sign for the health of global trade. The data, released in recent days by individual airport authorities, brought to an end a months-long stretch of rapid growth in air freight volumes across the U.S. and Europe. The abrupt reversal demonstrated how rapidly economic problems in China and other emerging markets have already reduced the flow of goods around the world… Air cargo is widely tracked as a leading indicator for trade because shippers deciding whether to send items by plane are often swayed by last-minute economic developments. The recent drop in volumes has analysts concerned, even as maritime shipping out of Asia has remained healthy.
(WSJ)
The slowdown in trade is reflected in the stock prices of some of those companies carrying high value Asian air freight…

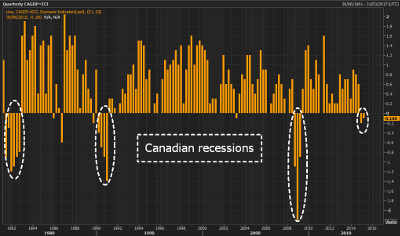
Meanwhile in Canada, the country is back in a technical recession. With their energy industry falling and it is impacting real estate prices and bank loans, the country looks to be in for a rough patch…
ReutersJamie: Canada slips back into recession – two consecutive quarters of falling GDP – its 4th since the early 1980s
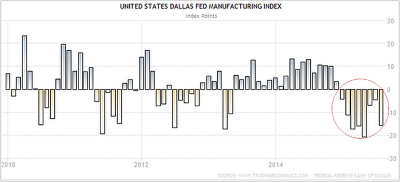
Similar to Canada, the Dallas Fed region is also in for a rough patch…
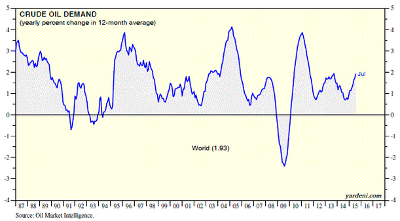
But while Energy industry participants hate to see crude at $40, the customers are asking for a second helping…
Our monthly analysis of global oil demand shows that the plunge in oil prices is stimulating usage, which suggests that the windfall is boosting economic growth around the world. Over the past 12 months through July, world oil demand rose to a record 94.6mbd, and is up 1.9% y/y, up from just 0.8% a year ago. The growth rebound can be seen in both advanced and emerging economies. Oil demand was up 5.4% in China during July, from 0.2% a year ago, to a new record high. India’s usage is up 5.6%, the fastest pace since May 2008.
(Yardeni)
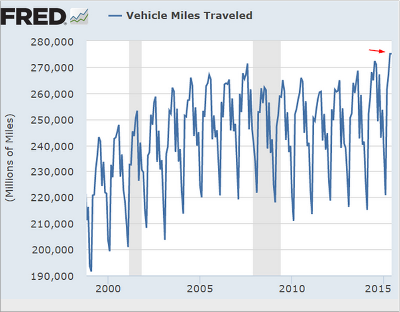
Even U.S. drivers are putting the pedal to the metal. Great news for the auto parts retailers like Autozone (NYSE:AZO), O’Reilly and Advance Auto Parts (NYSE:AAP)…
(SoberLook)
Lowest gasoline prices in 9 years is firing up driving demand…
The U.S. average retail price for regular gasoline was $2.51/gallon (g) on August 31, the lowest price for the Monday before Labor Day since 2004, and 95¢/g lower than the same time last year. Declines in crude oil prices are the main driver behind falling U.S. gasoline prices. Lower crude oil prices reflect concerns about economic growth in emerging markets, expectations of higher oil exports from Iran, and continuing actual and expected growth in global crude oil inventories.
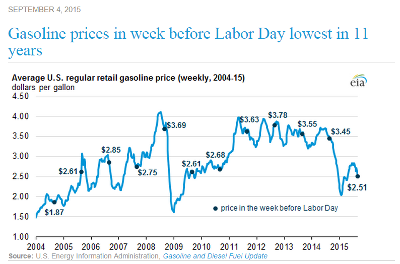
(EIA)
In addition to driving more, the overflowing U.S. consumer wallet is buying even more Legos!
Everything is cool when your first-half revenue is up by 18 percent on the year and currency shifts are beefing up your coffers without you even trying. Blocky Danish toy giant Lego is trumpeting “double-digit growth in all geographic regions,” with 18 per cent revenue growth in local currency terms, rising to 23 percent factoring in exchange rate moves. Net profits at the privately-held company in the first half of the year rose by nearly 31 per cent to DKr3.553 bn ($536m) compared to the same period last year, with Asia generating the highest growth rates.
(FastFT)
