
Time to take a step back…
While volatility can be profitable to trade for some, it is typically unsettling for the majority of investors. The last 6 months have seen an increase in volatility across Commodities, Foreign Exchange, High Yield Debt and Global Equities. As the below chart shows, even the S&P 500 was witness to the spike in volatility as it incurred nine 1%+ daily moves and nineteen 1%+ daily trading ranges. Wild volatility is a sign of investor uncertainty. So unless you know exactly how the Macro and Micro data points are going to play out, it is prudent to have some idle cash to be able to take advantage of any further investor unease.
A monthly chart of the VIX shows that January 2015 has not been as unsettled since early 2012…
Chalk it up to uncertainty surrounding any/all of the following issues: Energy, Greece, Russia, Fed rate hike timing, the Strong U.S. dollar, Global deflation, Negative interest rates, Corporate earnings, a new Congress, the New England Patriots victory, Measles vaccinations?
Yeah, what he said…
“I’m not smart enough for nuance,” said the CIO. “So I focus on the obvious.” The S&P closed the month -3.1%. U.S. 10-Year yields fell 53bps to 1.64%. 5yr/5yr inflation swaps fell 18bps to 2.12%. “This is so obviously not a risk-on year, January tells you all you need to know.” Volatility jumped across all assets. And in a highly-leveraged world, volatility’s not your friend. “This isn’t a year to buy risk, it’s a year to be long volume and trade relative value. Which really means it’s a year to focus on FX.” (Eric Peters/Wknd Notes)
Another very heavy week of corporate earnings showed Q4 estimate beats continued strong, but 2015 estimates being lowered…
With 227 companies in the S&P 500 reporting actual results for Q4 to date, the percentage of companies reporting actual EPS above estimates (80%) is above the 5-year average, while the percentage of companies reporting actual sales above estimates (58%) is slightly below the 5-year average. In aggregate, companies are surpassing earnings estimates by 3.4%.
The energy sector remains the largest thorn in the side of 2015 earnings guidance…
A look at the Mega Caps in January showed that it was all about the Earnings results…
Nearly every big mover on this list was caused by its earnings report or that of a direct competitor, so a great month for stock pickers if your analysts guided you correctly; a brutal month for any analyst in the Financial Services or Energy space.
A quick glance at Mutual Fund Styles and Caps shows the destruction of Financials, Energy and Microsoft to the Large Cap Value and Core space…
For the week, there was no sector to avoid losses…
And more broadly, it was equally difficult. Gold stars to investors overweight Apple, Bonds and Homebuilders…
- Apple Earnings Tweet of the Week…
@davidu: Numerically, 1% of all humans on Earth bought an iPhone in Q4. Math: 7.125 billion people alive. @Apple sold 75 Million iPhones. Incredible!
- Samsung sold an equal number of phones, but take a close look at the Average Price and Margins between the two companies…
@amberkanwar: Apple and Samsung sold the exact same number of smartphones last quarter. But with very different results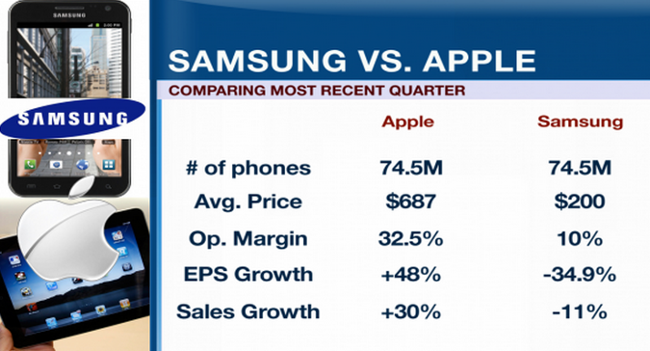

Just an incredible unit volume production ramp for one of the world’s largest companies…
Apple's (NASDAQ:AAPL) operating prowess was on full display in FQ1 as the company amazingly managed to ship 74.468m iPhones in FQ1 representing an 89.6% Q/Q unit volume increase and a Y/Y unit increase of 120.3%. We had thought that demand would be exceptionally high for the larger format iPhone6/6+ but we had equally expected manufacturing limits to keep volume shipment in FQ1 closer to our 64.8m unit forecast. We can’t emphasize enough how difficult this kind of one quarter ramp in production volume is nor the execution excellence that Apple just displayed by pulling it off.--(JPMorgan)

Now at the other side of the corporate earnings spectrum, an image from one of our readers in the Energy industry…
One of the Super Major’s, Shell, is using $60/barrel in their 2015 budgets…
Big Oil is supposed to provide a fortress amid turmoil in the energy market. But the first set of fourth-quarter results from the supermajors, Royal Dutch Shell A (NYSE:RDSa) on Thursday, clearly didn’t reassure: The stock dropped almost 5%. Shell’s published sensitivities imply that if Brent were to average $60 a barrel this year – actually higher than what futures currently imply – it would chop roughly $13 billion off operating cash flow, all else being equal. That still implies about $32 billion in 2015. Yet analysts still forecast closer to $37 billion, according to FactSet. And Shell’s capital expenditure, even under new guidance, will likely still be north of $30 billion, so it will have to borrow to also cover its $12 billion annual dividend bill.
Some of the other significant Capex cuts that hit the oil patch last week…
- BP (NYSE:BP) has said it will cut 300 staff and contractor jobs from its 3,500-strong North Sea business and freeze salaries across the company in an attempt to cut costs. It has also sold down its equity interests in two massive Gulf of Mexico oilfields and relinquished its position as operator.
- French major Total SA (NYSE:TOT) announced earlier this month that it planned to reduce group-wide capital spending by 10 percent this year and speed up billions of dollars in asset disposals.
- Shell, the largest European oil group, said it would “curtail” its capital spending by $15bn over 2015-17, representing 40 projects that would be delayed or cancelled. Its spending for this year, however, is set to be only slightly lower than the $35bn it spent in 2014.
- ConocoPhillips (NYSE:COP), the largest U.S. exploration and production company, said it planned a much steeper 33 percent cut in its capital spending this year to $11.5bn, $2bn less than it had suggested in its previous guidance issued only last month.
- Occidental Petroleum (NYSE:OXY), the fourth-largest U.S. oil producer by market capitalization, also said it would cut this year’s spending by 33 percent
Meanwhile, Chevron moved quickly to halt their stock repurchase…
@bespokeinvest: Suspending a buyback program after a 25% decline in your stock. Isn’t it supposed to work the other way around? NYSE:CVX
Energy makes up 1/3 of S&P 500 capex and less than 10% of stock repurchase activity…
A safe bet to cancel all Energy stock repos for now. More critical will be to watch how the U.S. economy absorbs this large cutback in capex. Will other industries lift their spending as their cost structures and growth opportunities increase? Unfortunately, the transition will not be smooth. It never is. Energy industry workers will need to be flexible and transition quickly if Oil prices stay below $50 a barrel.
Next up to run the gauntlet will be the State of North Dakota…
Oil prices have been cut in half, and so has North Dakota’s budget… The budget Gov. Jack Dalrymple unveiled in December hinged on oil selling for between $72 and $82 a barrel through the 2015-2017 budget cycle. But as oil prices plummeted, so did the state’s expectations. A revised state revenue forecast, presented to the North Dakota Legislature on Thursday, is based on the expectation of $42-per-barrel oil through the end of the current budget cycle and on oil prices selling in the range of $45 to $65 a barrel throughout the 2015-2017 biennium. The revised revenue forecast is built on the assumption that there will be 53 fewer oil wells in production each month – 135 wells instead of the anticipated 188 – at a loss of $250,000 in state sales tax per well. Fewer wells mean fewer workers, and the forecast knocked $35 million out of the budget to reflect the loss of high-paying jobs in the oil patch. Oil royalties drop by $4.9 billion in this forecast, corporate income tax collection drops by a third and individual income tax collections drop as workers lose jobs or find lower-paying work.
The banking industry is also taking hits from the crash in Energy…
To make a lot of money in bank stocks, you own them when credit quality is improving. It is brutally difficult to make money in them when credit quality is worsening. And after 4 years of $100 crude oil, which banker would not have tried to lend to the sector with a $50-$100 oil basis. But with oil now below $50, there will be some loans that won’t make it as written. As a result, Bank stocks are dragging the Financial sector to a difficult start for 2015.
But there must be investing beneficiaries of falling energy costs…
So what are investors to do? Favor oil-importing countries, and then favor well-positioned sectors within. Oil producing companies are a no-go at the moment, as are fuel-intensive industries such as materials. Better growth can be found in industries that benefit from low prices, such as transportation, refineries and manufacturing, Airlines, for example, should benefit from low jet fuel prices, which have dropped more than 30 percent since last June to the lowest levels in four years. Chinese airlines are particularly well off because a low percentage of their fuel purchases are hedged, and thus locked in at higher prices. Consumer staples should also benefit since people are spending less of their paychecks on energy and therefore have more money left over for retail purchases. Other attractive sectors include Chinese, Thai, Brazilian and Malaysian industrials, Indian IT and consumer discretionary stocks and Chinese utilities.
And Visa (NYSE:V) was giving you some ideas on their conference call…
“U.S. fuel prices are down ~30% since June. The drop amounts to ~$60/month for the avg. consumer according to our survey. Approximately 50% of the savings are being saved, 25% is being used to pay down debt & ~25% is being spent in other discretionary categories including grocery, clothing & restaurants. As we look forward, we would anticipate the savings will accumulate & ultimately we’ll see more spend in the discretionary categories including higher ticket items (i.e., home improvement, electronics, travel and entertainment)”
Best news for Mom & Dad is that Junior is leaving the basement…
“Our best guess is that the jump in household formation is driven by accelerating job growth, lower oil prices, and higher consumer confidence, including for the Millennials. Altogether these forces have pushed up confidence in the housing market.” -- (Torsten Sløk, Deutsche Bank)
The numbers continue to show a ramp in Consumer Sentiment…
Consumers are more willing to spend because they feel more enthusiastic about the economy and their finances. The consumer sentiment index compiled by the University of Michigan’s Surveys of Consumers ended January at 98.1, the highest reading in 11 years. The report noted that sentiment is up 20% since July – just as oil prices start to swoon. Importantly, the gains over the past half year were as large for households earning less than $75,000 as they were for consumers making more than that.
Even the GDP data is seeing an accelerated contribution from Consumers…
@RBS_Economics: Shoppers to the rescue. Personal consumption did the heavy-lifting for US GDP in Q4. Net exp. drag, inventories help.
While Hedge Funds have seen most of their asset growth come from appreciation the last few years, 2015 should see an actual increase in allocations; a good choice given all the uncertainty and volatility?
@LadyFOHF: Finally. Evidence is that allocators plan to increase their allocation to HFs, despite headline noise.
And finally, a play call that will likely be talked about until Super Bowl 50… Still one of the better Super Bowls we have seen in a while, and congrats to the Patriots…
Disclosure: The information presented here is for informational purposes only, and this document is not to be construed as an offer to sell, or the solicitation of an offer to buy, securities. Some investments are not suitable for all investors, and there can be no assurance that any investment strategy will be successful. The hyperlinks included in this message provide direct access to other Internet resources, including Web sites. While we believe this information to be from reliable sources, 361 Capital is not responsible for the accuracy or content of information contained in these sites. Although we make every effort to ensure these links are accurate, up to date and relevant, we cannot take responsibility for pages maintained by external providers. The views expressed by these external providers on their own Web pages or on external sites they link to are not necessarily those of 361 Capital.