
Breakout buying can be extremely rewarding when market conditions are solid and the proper setup comes along. Below are a few stocks from our internal watchlist that have explosive breakout potential.
Although price is king when analyzing charts, don’t forget about volume! Every trading day begins with a watchlist of stocks we believe may be ready to move significantly higher within the next few days. Once this list is prepared, it is just a matter of monitoring the price action and confirming the price with volume. Volume let’s us know just how much potential the trade has.
Always trade with a protective stop. Stops can be placed beneath a significant swing low (if one is around) or simply 5% below an entry. Stops within 3-8% of the entry work best. Use common sense when setting stops.
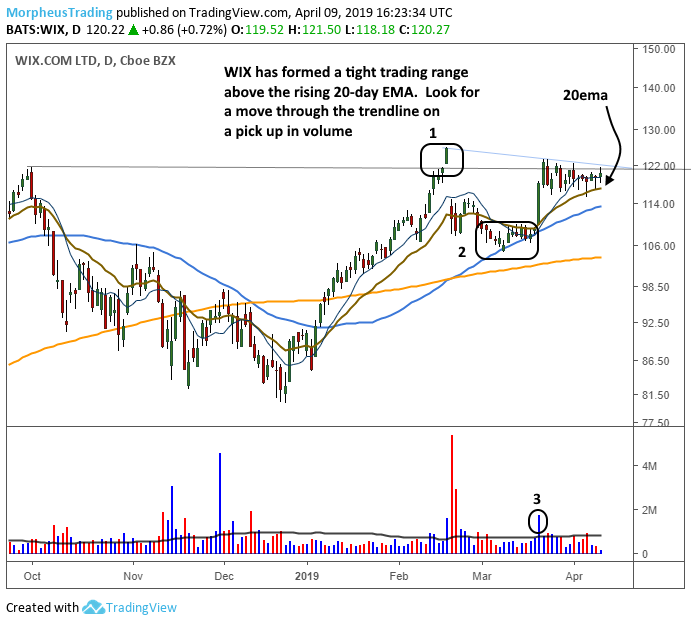
Of the stocks below, we are currently long $WIX in our swing and position trading newsletter The Wagner Daily, which is emailed to subscribers Sunday through Thursday night.
Wix.com ($WIX) failed a recent breakout attempt at (1) and pulled back to the 50-day MA at (2) where it found support. The price action has tightened up the past few weeks after moving off the 50-day MA on a pick up in volume at (3).
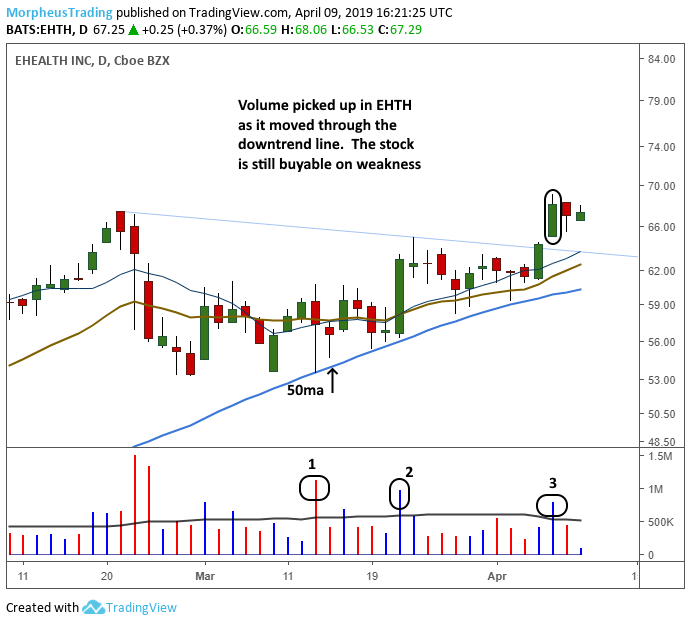
Ehealth ($EHTH) has already cleared its downtrend line on volume at (3) after consolidating for a few weeks above the rising 50-day MA, which is a bullish sign. Note the higher volume reversal off the 50-day MA at (1) and move through resistance off the 50-day MA at (2). $EHTH is buyable on weakness.
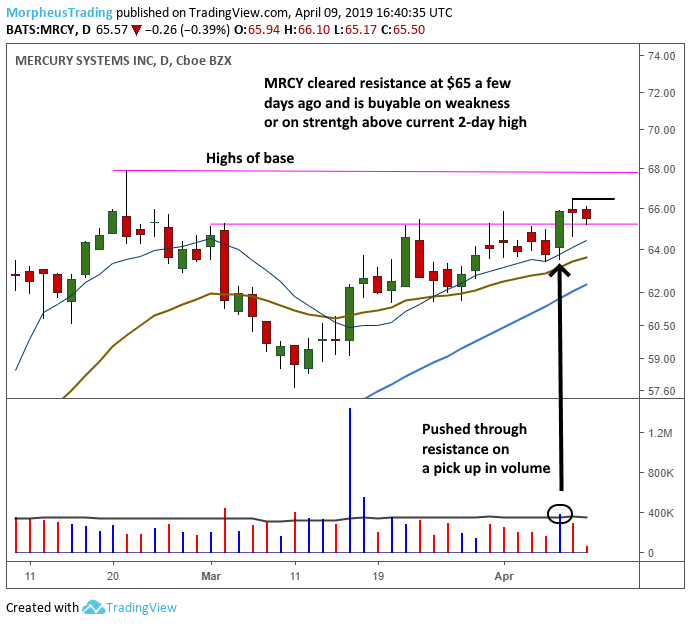
Mercury Systems ($MRCY) has been in chop mode for several weeks above the rising 50-day MA. However, not pictured below is the weekly chart, which has bounced off the 10-week moving average. Most of our setups are either bouncing off the 50-day MA on the daily or 10-week MA on the weekly, which is usually just a bit higher than the 50-day MA.
$MRCY pushed through resistance on a pick up in volume a few days ago and may be ready to move significantly higher on a big volume breakout above $66.50.
When buying a breakout during the day it is impossible to know whether or not the stock will close with strong volume. However, some trading platforms may have a built in volume indicator that displays whether volume is above or below average for the time of day. The higher the volume is above average the better. If one does not have access to such an indicator, then look at volume vs average volume on a 5-minute intraday chart. Are recent spikes on the 5-minute chart well above average? If the breakout is during the first hour of trading, then look for volume to be at least 25-30% of the 50-day moving average of volume.